Alibaba Stock Technicals Today: Drops 3.77%, Testing Support Level
On September 3, 2026: price 109.90 HKD, trend sideways, RSI 39.4, support 110.40, resistance 128.10. technical analysis of alibaba stock.
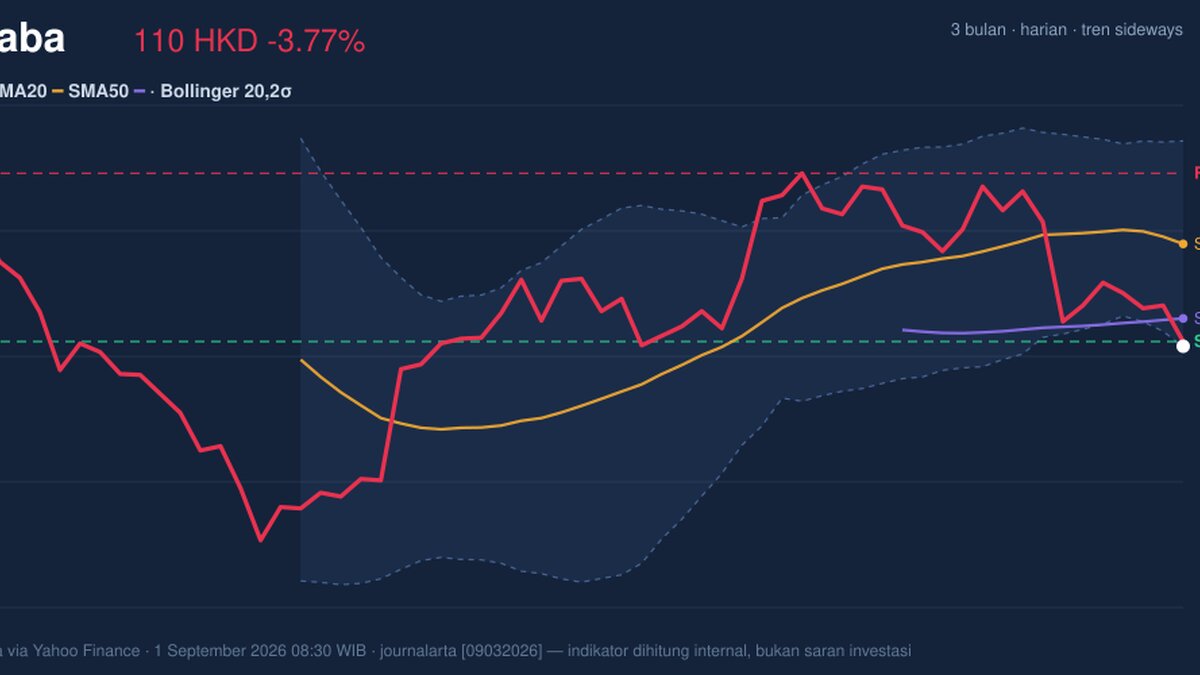
Alibaba Group’s Hong Kong-listed shares fell to HKD 109.90 on HKEX, slipping 3.77% from the previous close of HKD 114.20 as the stock pressed against a cluster of technical support levels, according to exchange data and Yahoo Finance. The move matters because it leaves the shares below both the short-term and medium-term trend lines, while momentum gauges are flashing a split message: price is weak, but parts of the market are already stretched to the downside.
Trend & Price Action
The chart shows Alibaba trading below SMA20 at HKD 120.67 and also below SMA50 at HKD 112.82, which is the clearest sign that recent price action remains under pressure. When a stock sits under both moving averages, it usually means rallies are being sold rather than rewarded. The trend is still described as sideways, but the SMA20 slope of -0.94% over 5 days shows that the sideways label is not flat; it is leaning lower. That is important because a sideways market with a downward tilt often acts like a pause inside a broader drift down, not a stable base.
The stock is also trading near the bottom of its recent band. With 20-day support at HKD 110.40 and the last price at HKD 109.90, Alibaba is effectively sitting on support, not above it. That is a fragile position. The 3-month low of HKD 88.65 still sits well below, but the 3-month high of HKD 131.20 and the 20-day resistance at HKD 128.10 show how much ground would need to be recovered before the chart looks healthier.
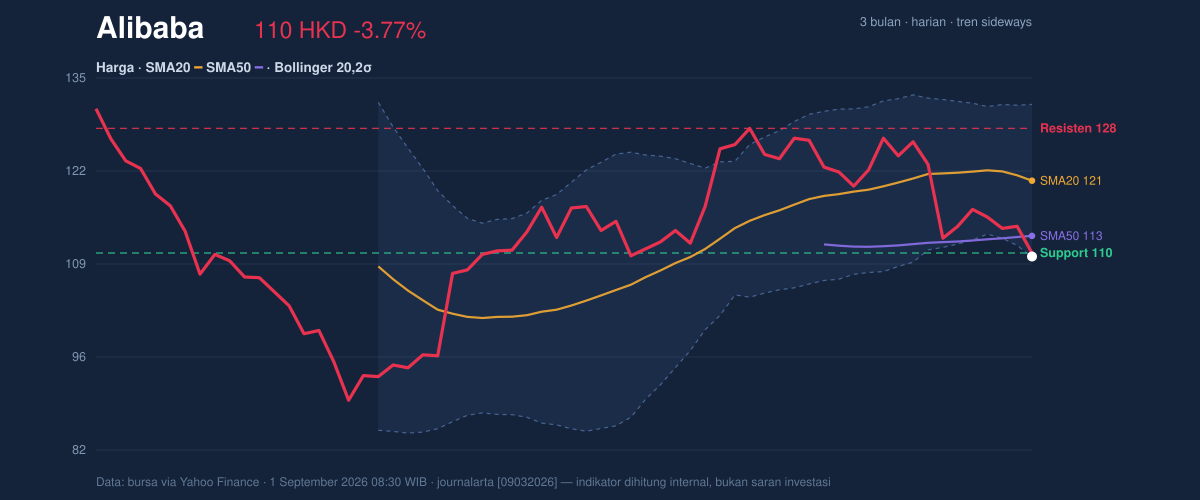
The Bollinger Bands reinforce that message. Price is at %B 0%, which means it is pinned to the lower band at HKD 109.84. In plain English, the stock is trading at the edge of its recent statistical range. That can sometimes precede a bounce, but only if buyers step in quickly; otherwise it often signals that downside pressure is still controlling the tape.
A short line matters here: the floor is being tested.
Oscillators & Momentum
Momentum indicators are not fully aligned, which is why this is not a clean breakout or breakdown setup. The RSI at 39.4 is still neutral, not oversold, so the broader momentum picture has weakened but not yet reached an extreme. That tells readers the stock is soft, but not necessarily exhausted.
The Stochastic %K at 4.4 and %D at 14.7 are the more urgent signals. Stochastic measures where the price sits relative to its recent range, and readings this low are typically read as oversold. In other words, the stock has been pushed down quickly enough that it may be vulnerable to a rebound. But oversold does not mean it must rise; it only means selling may be getting crowded.
The MACD picture is still negative. With MACD at -0.915, the signal line at 0.746, and a histogram of -1.661, downside momentum remains dominant. The histogram being negative and wide is significant because it shows the MACD line is below its signal line by a meaningful margin; that usually means the short-term trend is still underperforming the longer one. So even though Stochastic is oversold, MACD has not yet confirmed a turn.
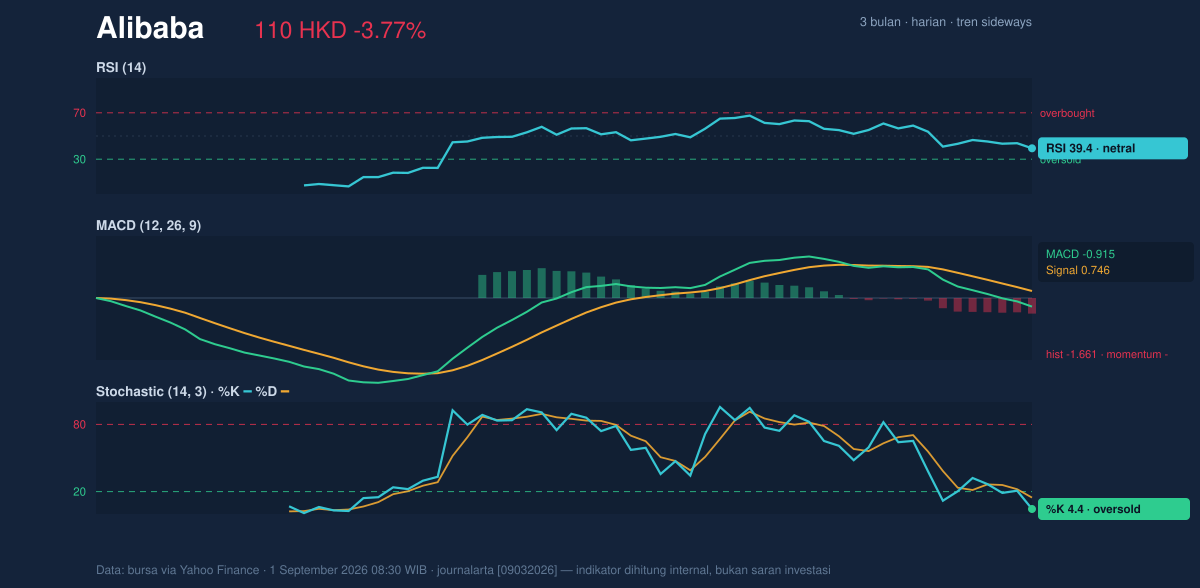
This is the classic tension in technical analysis: one oscillator says the stock is stretched, another says the trend is still falling.
Volatility & Volume
Volatility is elevated enough to matter. The ATR(14) is 4.71, or 4.3% of price, which means a normal daily move is still fairly wide. For readers, ATR is a measure of average daily movement; a higher number means the stock can travel farther in either direction without that being unusual. That makes the current area around support especially sensitive, because a small failure to hold can quickly turn into a larger move.
Bollinger band width is 17.9%, described as normal rather than compressed. That suggests the market is not sitting in a low-volatility squeeze waiting for a sudden expansion; instead, it is already in a reasonably active state. With price at the lower band, the next move can be sharp if support gives way or if bargain-hunting appears.
Volume offers a mixed confirmation. Last volume was 99,751,649, almost exactly 1.0× normal versus the 20-day average of 98,265,345. So the selloff is not being driven by a dramatic volume spike, which slightly limits the urgency of the decline. But OBV is falling, and that matters because OBV, or on-balance volume, tracks whether volume is flowing into or out of the stock over time. A falling OBV says distribution is still outweighing accumulation, even if the day’s turnover is not extraordinary.
Key Levels & Scenarios
The immediate technical map is straightforward. HKD 110.40 is the nearest support, and the stock is already trading just below it. On the upside, HKD 112.82 marks the SMA50, then HKD 120.67 the SMA20, and HKD 128.10 the 20-day resistance. The market is currently only 3% from the 20-day range floor, which means the next few sessions could decide whether this becomes a stabilization attempt or a deeper slide.
If HKD 110.40 fails to hold, the chart would likely shift attention toward the lower end of the 3-month range near HKD 88.65. If price can reclaim HKD 112.82 and then HKD 120.67, it would improve the short-term structure and reduce the pressure created by the lower Bollinger band test.
Technical Verdict: HOLD (wait & see)
HOLD (wait & see) fits best because the stock is sitting on support with Stochastic oversold conditions, but MACD remains negative and price is still below SMA20 and SMA50. The chart is stretched, yet not repaired. The Bollinger lower-band test and falling OBV say sellers still have influence, while the RSI at 39.4 suggests the move is weak but not yet washed out.
- Ideal Entry Range: HKD 109.84 to HKD 112.82, where lower-band support and the SMA50 overlap
- Exit Target (Target Price): HKD 120.67, with a secondary resistance zone at HKD 128.10
- Stop Loss protection: below HKD 109.84 or, more conservatively, below HKD 110.40
- Verdict invalidated if price breaks below HKD 109.84, because that would confirm a loss of the lower Bollinger band and the nearest support
For non-traders, this means the stock is near a technical floor, but it has not yet proved that the selling pressure is over.
Alibaba’s last price was HKD 109.90 on HKEX.
Summary Data Alibaba
| Last price | 109.90 HKD |
| Change 1 day / 5 days / 1 month | -3.77% / -3.77% / -12.64% |
| Trend / MA-cross | sideways / none |
| SMA20 / SMA50 | 120.67 / 112.82 |
| RSI (14) / Stochastic %K | 39.4 / 4.4 |
| Bollinger %B / ATR | 0% / 4.71 |
| Support / Resistance 20 days | 110.40 / 128.10 |
| Data as of | 1 September 2026 08:30 WIB |
Track Alibaba share price daily: live levels, support/resistance and our full Alibaba analysis history.