AstraZeneca Momentum Gains: Stock Gains 0.05% (September 3, 2026)
On September 3, 2026: price 11,976.00 GBp, trend sideways, RSI 44.8, support 11,460.00, resistance 12,476.00. technical analysis of astrazeneca stock.
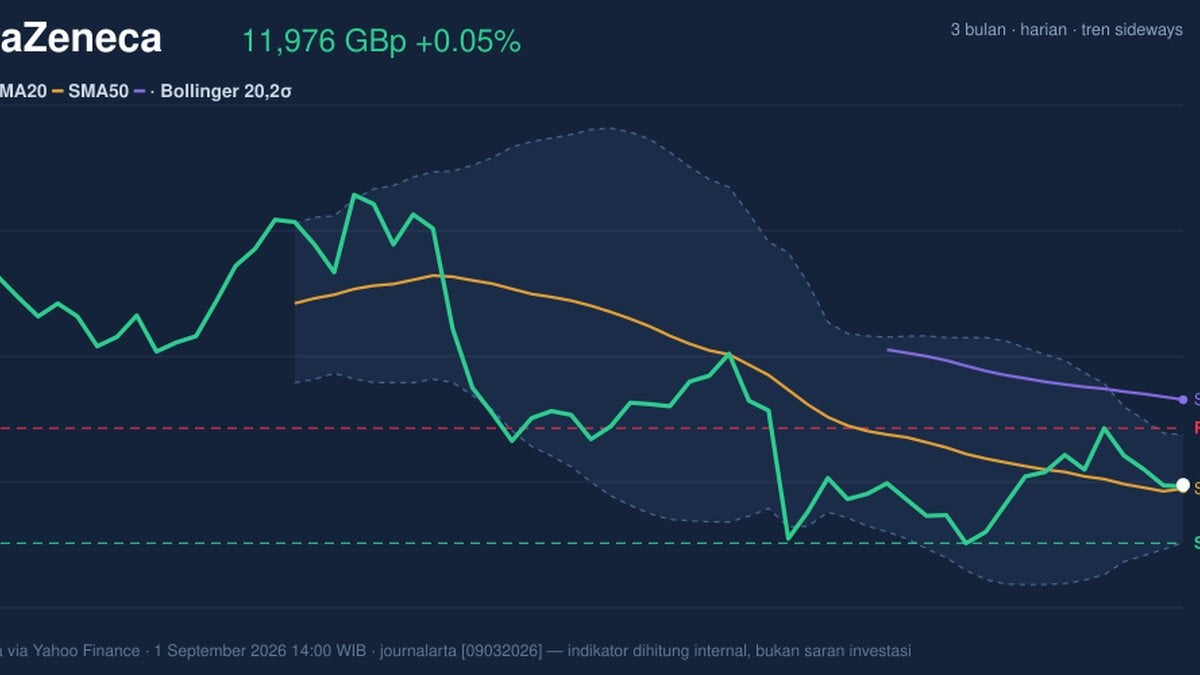
AstraZeneca shares on the LSE were little changed at 11,976.00 GBp at 14:00 WIB on 1 September 2026, edging up 0.05% on the day, but the quieter tape masks a more interesting technical setup: the stock is holding just above its short-term average while still trading well below its longer one, and the chart is tightening, as shown in the price action panel.
Trend & Price Action
The first signal is that AstraZeneca remains in a sideways trend, not a clean uptrend or downtrend. That matters because sideways markets often reward patience more than conviction: price can drift without direction until a catalyst forces a break.
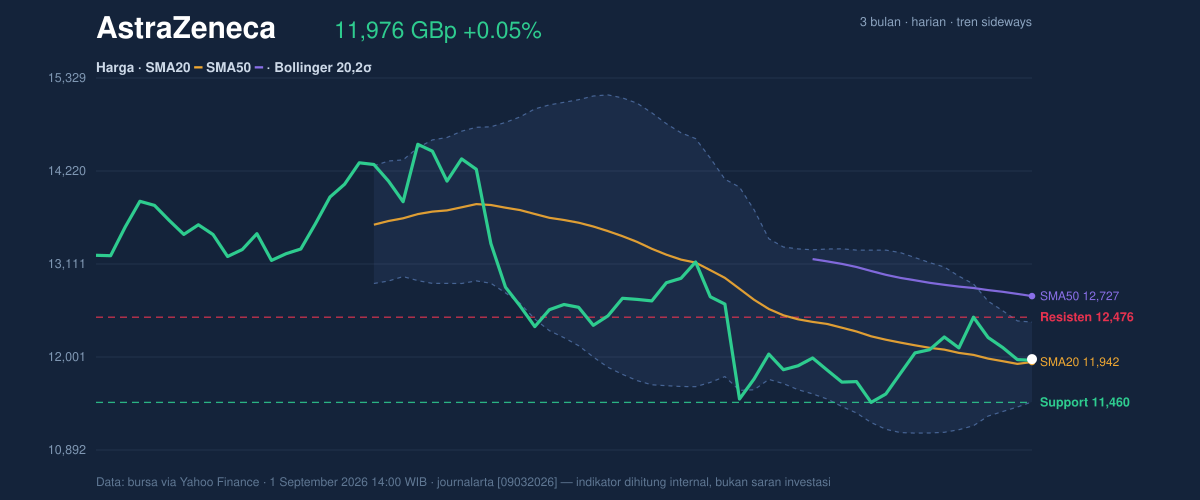
The shares are trading above SMA20 at 11,941.80 but still far below SMA50 at 12,727.24. In plain terms, the stock has enough short-term support to avoid immediate technical damage, yet it has not repaired the medium-term weakness that the 50-day line represents. The lack of a fresh MA-cross also says the market has not produced a decisive trend shift. A golden cross would have suggested improving medium-term momentum; a death cross would have warned of deterioration. Neither is present, so the chart is still waiting for confirmation.
The Bollinger Band structure adds another layer. With the upper band at 12,417.70, the middle band at 11,941.80 and the lower band at 11,465.90, price sits near the middle of the range at about 51% of the 20-day corridor. That is not an overextended reading. More importantly, the band width has narrowed to 8.0%, which points to a squeeze. In market terms, that means volatility has compressed and the next move could be sharper than recent daily changes suggest. Squeezes do not predict direction, but they do warn that calm conditions may not last.
Oscillators & Momentum
The momentum picture is mixed rather than decisive. RSI at 44.8 is neutral, but it leans slightly soft, which means the shares are neither oversold nor showing the sort of strong upside pressure that usually accompanies a sustained breakout. Stochastic %K at 52.1 and %D at 57.0 are also neutral, with no obvious overbought or oversold signal. That tells readers the stock is not stretched in either direction.
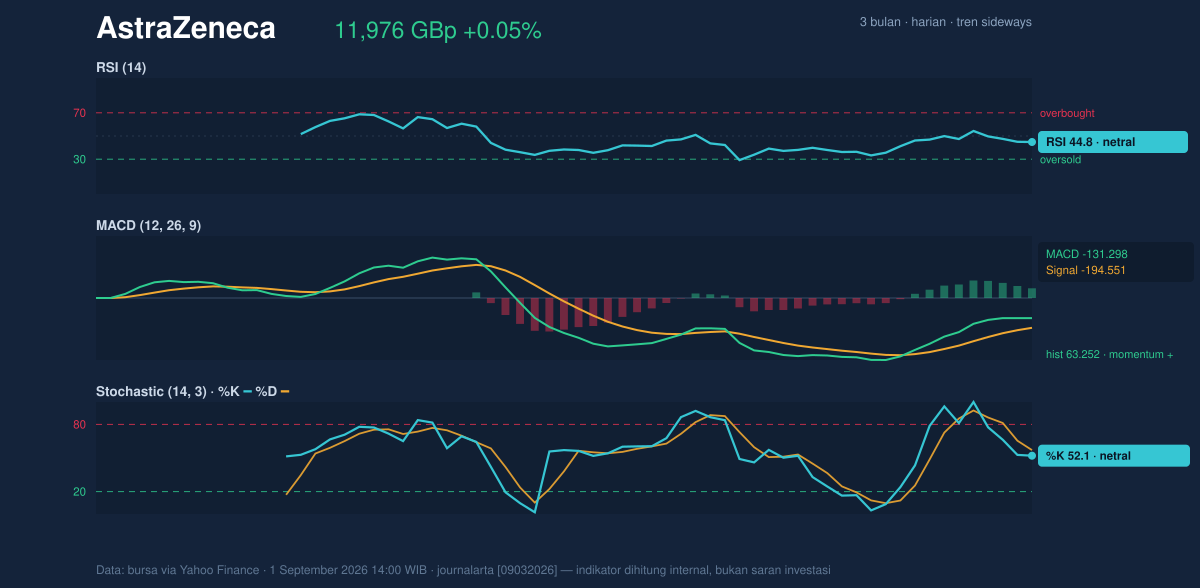
The more constructive signal comes from MACD. MACD at -131.298 is still below zero, which normally implies the broader momentum backdrop has not fully turned positive. But the histogram at 63.252 is positive, and the signal line at -194.551 sits below the MACD line. That combination suggests downside momentum is fading and the trend may be trying to recover, even if it has not yet crossed into outright bullish territory. In other words, the stock is not strong, but it is less weak than the headline MACD level alone would imply.
Volatility & Volume
Volatility is moderate rather than elevated, with ATR(14) at 280.14, equal to about 2.3% of the share price. ATR measures the average daily trading range, so this reading suggests AstraZeneca can still move meaningfully in a session, but not in a panic-driven way. Combined with the Bollinger squeeze, that means the next directional move could be more important than the recent flatness indicates.
Volume, however, is not yet confirming that a breakout is underway. The latest turnover of 2,914,975 shares is only 0.8× the 20-session average of 3,807,027, and OBV is falling. OBV, or on-balance volume, tracks whether volume is supporting price advances or declines. A falling OBV while price holds steady is a warning that buyers have not fully reasserted control. The price is stable, but participation is thin.
Key Levels & Scenarios
The nearest technical floor is 11,460.00, which also aligns closely with the lower Bollinger band at 11,465.90. That makes this zone important: if the shares lose it, the squeeze would likely resolve to the downside and the chart would look less constructive. On the upside, 12,476.00 is the immediate resistance, just above the upper band at 12,417.70. A move through that area would show the stock is escaping the current range and would put the 50-day average at 12,727.24 back in view.
The stock is currently sitting near the middle of its 20-session range, and the longer three-month range still frames the bigger picture: 15,126.00 on the high side and 9,892.00 on the low side. That wider band shows AstraZeneca has already recovered from a deeper drawdown, but it has not yet reclaimed its prior highs. For now, the chart is one of stabilization rather than clear acceleration.
Technical Verdict: HOLD (wait & see)
HOLD (wait & see) is the cleanest reading from the current setup.
- Reason 1: price is above SMA20, which supports short-term stability, but below SMA50, which keeps the medium-term trend unresolved.
- Reason 2: MACD histogram is positive, showing improving momentum, yet RSI at 44.8 and Stochastic at 52.1 / 57.0 remain neutral rather than confirming a strong breakout.
- Reason 3: Bollinger bands are squeezing with 8.0% width, but volume is 0.8× normal and OBV is down, so the market has not yet proven that buyers are driving the next move.
Verdict invalidated if price falls below 11,460.00, because that would break the nearest support and the lower Bollinger boundary.
- Ideal Entry Range: 11,460.00 to 11,941.80
- Exit Target: 12,417.70 to 12,476.00
- Stop Loss protection: below 11,460.00
For non-traders, this means the shares are not clearly trending yet, but they are close to a level where the next move could become more decisive.
Summary Data AstraZeneca
| Last price | 11,976.00 GBp |
| Change 1 day / 5 days / 1 month | 0.05% / -1.11% / 4.14% |
| Trend / MA-cross | sideways / none |
| SMA20 / SMA50 | 11,941.80 / 12,727.24 |
| RSI (14) / Stochastic %K | 44.8 / 52.1 |
| Bollinger %B / ATR | 54% / 280.14 |
| Support / Resistance 20 days | 11,460.00 / 12,476.00 |
| Data as of | 1 September 2026 14:00 WIB |
Track AstraZeneca share price daily: live levels, support/resistance and our full AstraZeneca analysis history.