BP Stock Technicals Today: Gains 5.44%, Momentum Weakens
On September 3, 2026: price 542.50 GBp, trend sideways, RSI 55.8, support 514.50, resistance 552.20. technical analysis of bp stock. BP Stock Technicals — full…
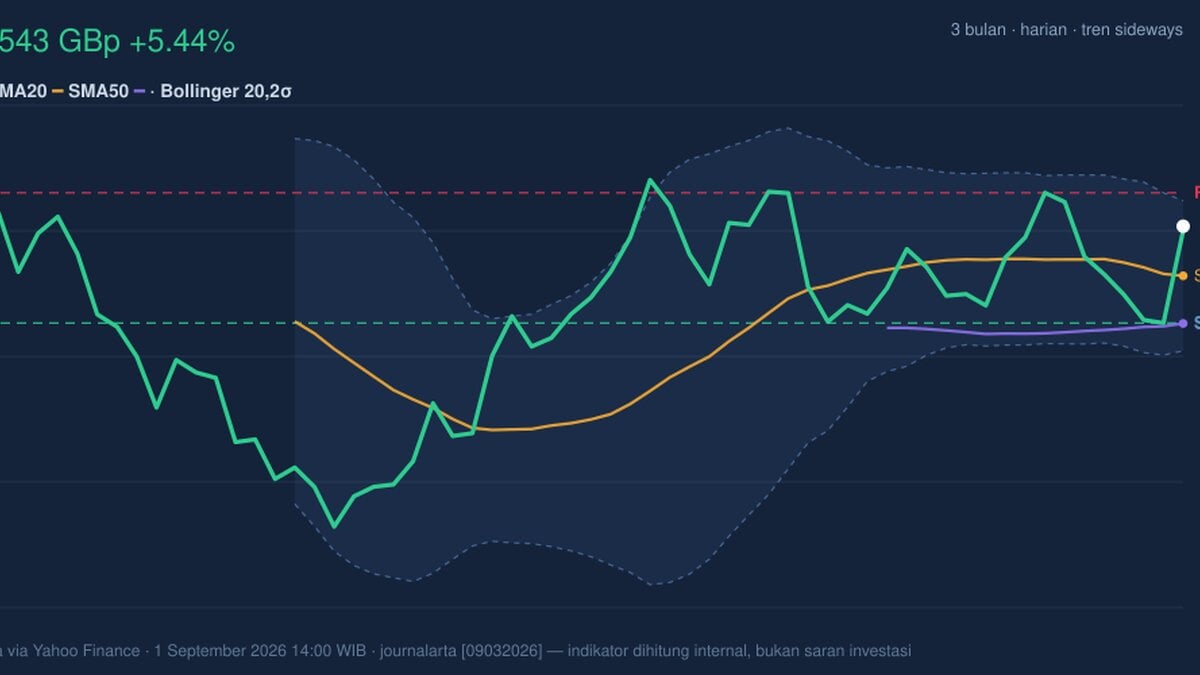
BP plc’s London shares are back above a key short-term average, but the tape still looks more like a range trade than a clean trend. The move to 542.50 GBp after a 5.44% one-day rise has pushed the stock closer to the upper end of its recent band, yet several momentum gauges say the advance is not fully confirmed.
Trend & Price Action
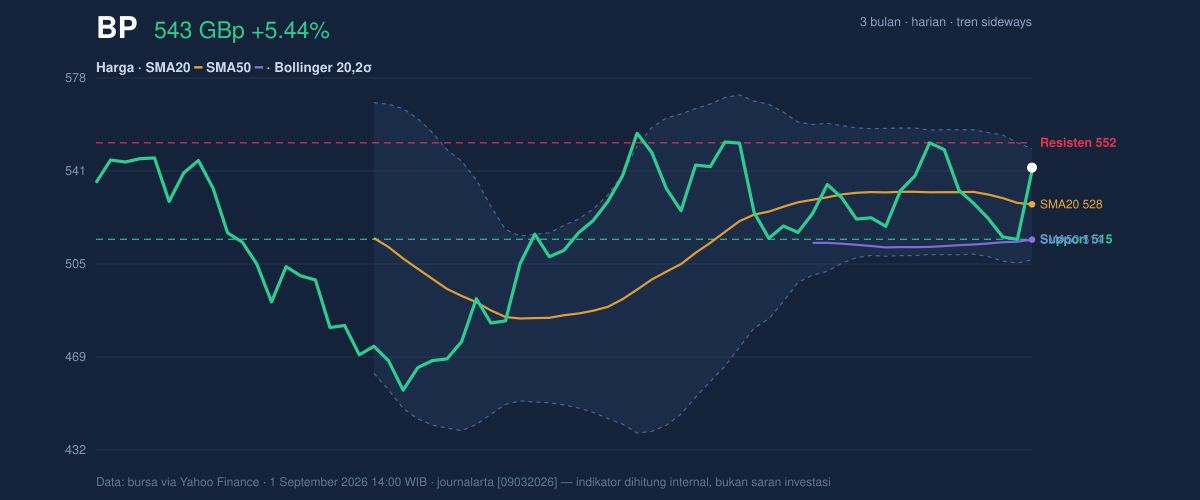
BP’s latest close sits above the SMA20 at 528.18 and above the SMA50 at 514.40, which is constructive on a short-to-medium-term basis. But the broader message from the chart is still one of hesitation rather than conviction. The trend is described as sideways, and the SMA20 slope of -0.88% over 5 days shows the short-term average is still edging lower. That matters because a rising share price above a falling average often signals a bounce inside a range, not necessarily the start of a durable breakout.
As shown in the chart, BP is trading at about 74% of its 20-day range, between 514.50 support and 552.20 resistance. That is close enough to the top of the band to suggest the market is testing supply, but not yet far enough to declare a breakout. The stock also remains below its 3-month high of 562.90, which keeps the recent rally in context: there is room to recover, but the market has not yet repaired the full drawdown from the upper end of the quarterly range.
Oscillators & Momentum
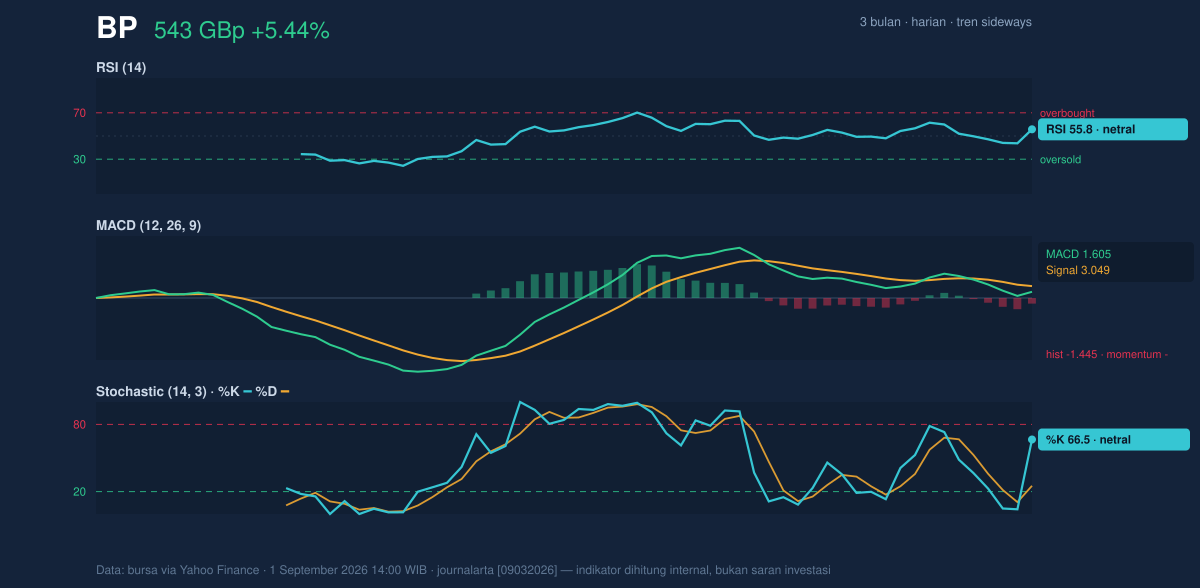
Momentum is mixed, and that is the most important signal in the data. The RSI at 55.8 is neutral, which means the shares are neither overbought nor oversold. In plain English, the market is not stretched enough to force a reversal, but it is also not showing the kind of strong momentum that usually accompanies a decisive trend change.
The stochastic oscillator is also in neutral territory, with %K at 66.5 and %D at 25.2. That wide gap can hint at a short-term lift, but it is not yet a clean, synchronized signal. More telling is the MACD setup: MACD at 1.605 versus signal at 3.049, with a -1.445 histogram. When the histogram is negative, the faster line is below the signal line, which usually means upward price action is losing internal momentum even if the share price itself is rising. In other words, the rally has improved the chart, but the engine is still not firing cleanly.
That divergence between price and momentum is why the move looks tentative rather than decisive. It is the kind of pattern traders watch for either a pause near resistance or a fresh push only if volume and breadth improve.
Volatility & Volume
Bollinger Bands show BP is now leaning toward the upper side of its recent envelope. The share price is near the top band at 549.90, with %B at 83%. That means the stock is trading high within its recent volatility range, but not yet outside it. The 8.2% band width is described as normal, so this is not a compression setup that typically precedes an explosive move. Instead, it suggests the stock has room to move, but the market has not yet entered an unusually tight or unusually stretched phase.
ATR adds another layer. ATR(14) at 13.48, or about 2.5% of price, points to moderate day-to-day movement. That level of volatility is enough for the stock to test nearby support or resistance without needing a major news shock. It also means a failed push can unwind quickly if momentum fades.
Volume is the one area where the latest session looks more convincing. The day’s turnover of 92,515,934 shares was about 1.7× the 20-day average of 53,649,219. Heavy volume usually matters because it shows more participants are involved in the move. But the OBV is down, and that is a caution flag: on-balance volume tracks whether volume is accumulating into rises or distributing into weakness. A falling OBV while price lifts often suggests the rally has not yet won broad sponsorship. That mismatch is why the recent jump should be read as a test of sentiment, not a confirmed shift in regime.
Key Levels & Scenarios
The chart’s immediate battleground is clear. 514.50 is the nearest support and also the lower edge of the 20-day range. If the shares hold above that area, the current rebound remains intact and the market can keep probing the upper band. If that floor gives way, the chart would likely shift back toward the middle of the recent range, where the SMA50 at 514.40 sits almost on top of support.
On the upside, 549.90 is the Bollinger upper band and 552.20 is the nearest resistance. A move through that zone would matter because it would place the stock beyond both the recent volatility ceiling and the current range high. Until then, the shares are still trading beneath the level that would signal a cleaner breakout. The 3-month high of 562.90 remains the broader reference point for any sustained recovery.
Technical Verdict: HOLD (wait & see)
HOLD (wait & see) — the price is improving, but momentum has not fully confirmed the move.
- Reason 1: Price is above both the SMA20 at 528.18 and SMA50 at 514.40, which supports the rebound.
- Reason 2: MACD is negative on the histogram, showing the rally still lacks strong internal momentum.
- Reason 3: OBV is down even as volume spikes, which weakens the case that buyers are fully in control.
- Invalidation condition: this verdict is invalidated if price falls below 514.50, the nearest support and lower edge of the 20-day range.
- Ideal Entry Range: 514.50 to 528.18
- Exit Target (Target Price): 549.90 to 552.20
- Stop Loss protection: below 514.50
In plain English: BP is trying to recover, but the chart still needs proof before the move can be treated as durable.
Summary Data BP
| Last price | 542.50 GBp |
| Change 1 day / 5 days / 1 month | 5.44% / 1.65% / -1.74% |
| Trend / MA-cross | sideways / none |
| SMA20 / SMA50 | 528.18 / 514.40 |
| RSI (14) / Stochastic %K | 55.8 / 66.5 |
| Bollinger %B / ATR | 83% / 13.48 |
| Support / Resistance 20 days | 514.50 / 552.20 |
| Data as of | 1 September 2026 14:00 WIB |
Track BP share price daily: live levels, support/resistance and our full BP analysis history.