DBS Stock Gains 0.26% Today, Testing Key Resistance
On September 3, 2026: price 77.60 SGD, trend uptrend, RSI 60.7, support 73.55, resistance 77.40. technical analysis of dbs stock. DBS Stock Gains — full…
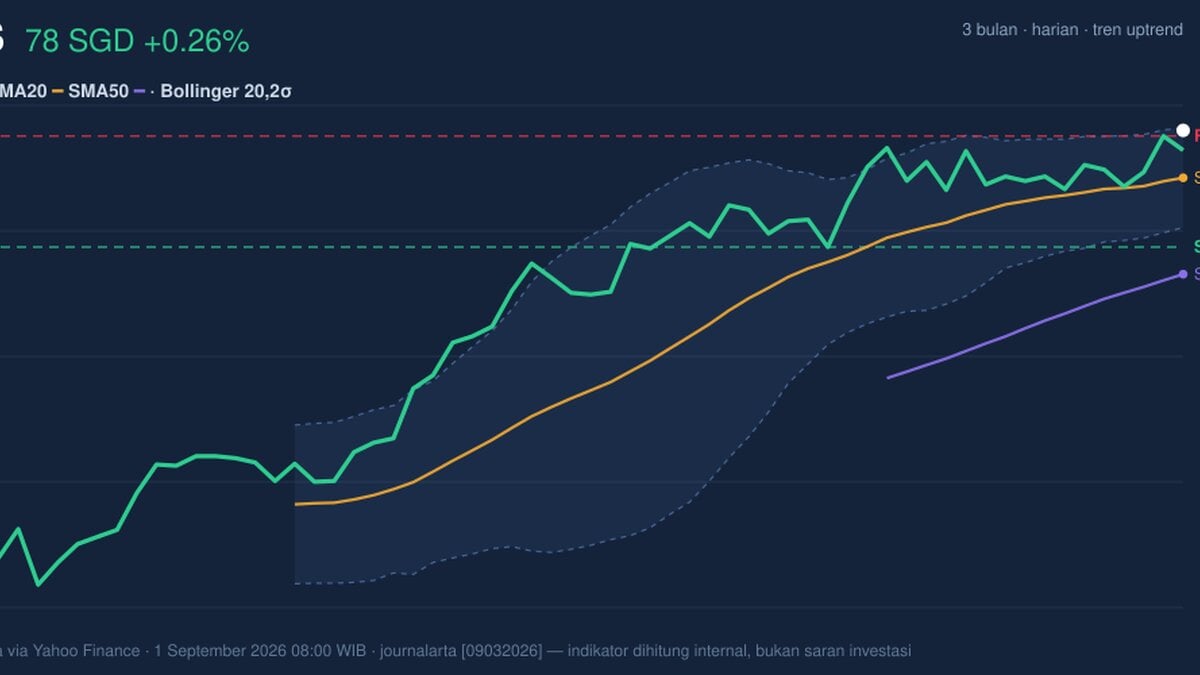
DBS Group’s shares were last quoted at 77.60 SGD, just above the previous close of 77.40, extending a steady climb that has lifted the stock 1.57% over 5 days and 4.23% over 1 month. The move keeps DBS in an established uptrend, but the latest print also leaves it pressed against the upper edge of its recent trading band, where momentum signals and price action are starting to diverge. That matters because when a bank stock sits this close to resistance, the question is no longer whether the trend is intact — it is whether buyers still have enough force to push through the ceiling.
Trend & Price Action
DBS remains technically constructive. The share price is above both the SMA20 at 75.95 and the SMA50 at 72.61, a classic sign that the short- and medium-term trend are aligned in the same direction. The SMA20 is rising at 0.67% over 5 days, which signals that the near-term trend still has positive slope rather than flattening out. There is no new MA-cross, so the picture is one of trend continuation rather than a fresh technical breakout signal.
What stands out is location. DBS is trading at 77.60, while the 20-hour resistance is 77.40 and the 3-month high is 77.97. In plain terms, the stock is already operating near the top of its recent range, with little room before it runs into the highest level seen over 3 months. That usually invites either a pause or a test of whether buyers can absorb supply at the top.
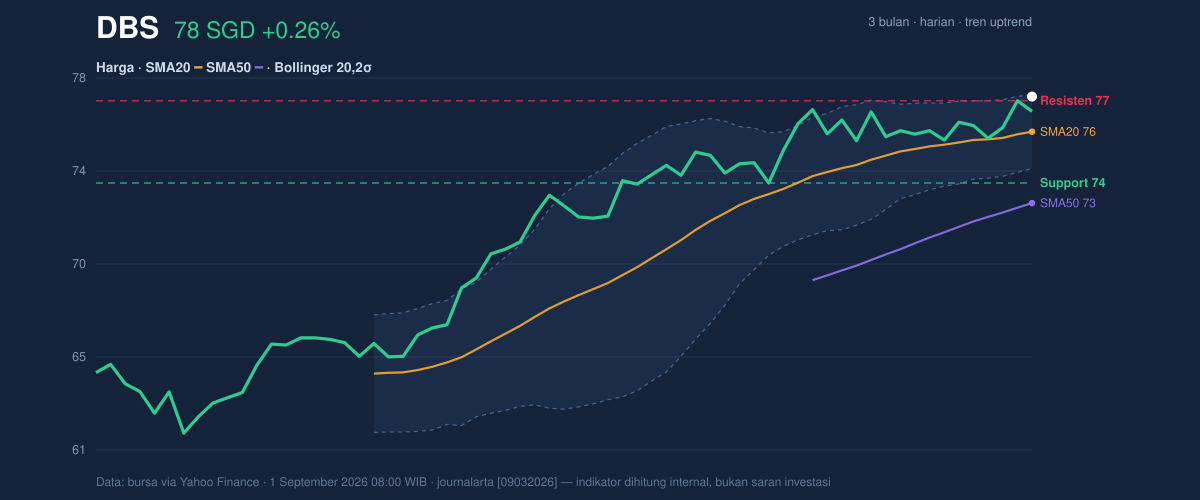
The Bollinger setup reinforces that tension. Price is sitting near the upper band at 77.68 with %B at 98%, meaning DBS is trading almost at the top of its statistical range over the last 20 sessions. At the same time, the band width is only 4.5%, described as a squeeze. A squeeze often precedes a larger move, but it does not tell direction on its own. It simply says the stock has been compressing, so any break above resistance or slip back under support could expand quickly.
Oscillators & Momentum
The momentum board is more mixed than the trend board. RSI at 60.7 is neutral, which is important: it shows DBS is not overbought in the extreme sense, but it is also not deeply oversold or offering a bargain signal. Stochastic %K at 68.7 and %D at 69.1 are also neutral, sitting in the upper half of the range without flashing a strong reversal warning. That combination says the stock still has room to move, but it is no longer in the early, fresh-momentum phase.
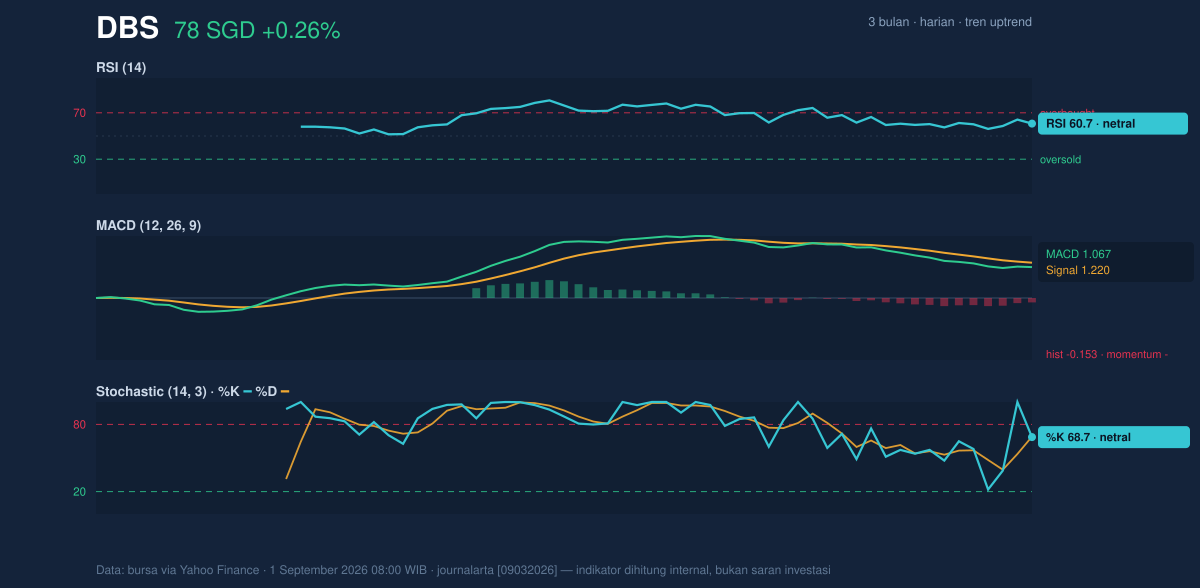
The more cautionary piece is the MACD at 1.067 versus the signal line at 1.220, with a histogram of -0.153. For readers unfamiliar with the term, MACD compares trend speed against its own smoother average; when the histogram turns negative, it means momentum is lagging the signal line even if price is still rising. In other words, the trend has not broken, but the engine is not accelerating as fast as the chart would like. That is a subtle warning, not a reversal call.
Volatility, Volume & Participation
Volatility is subdued. The ATR(14) is 1.12, or 1.4% of price, which indicates relatively low day-to-day movement. Low ATR often means the market is waiting for a catalyst or for a technical boundary to give way. Combined with the 4.5% Bollinger squeeze, this suggests DBS is coiling rather than trending explosively right now.
Volume, however, is not confirming a breakout yet. Last session’s volume was 3,867,231, below the 20-session average of 4,533,482, or about 0.9× normal. That matters because moves through resistance are usually more convincing when they come with heavier participation. The encouraging counterpoint is that OBV is rising, meaning cumulative volume flow is still trending upward even if the latest session was quieter. That often implies underlying accumulation, but it has not yet translated into a decisive surge in turnover.
Put simply: the stock is climbing, but the crowd is not rushing in.
Key Levels & Scenarios
The immediate reference points are clear. Support sits at 73.55, while resistance is 77.40, with the stock already trading just above that line at 77.60. If DBS can hold above the resistance band and push through the 3-month high at 77.97, the chart would move into fresh-high territory and the squeeze could release upward. If, instead, the price slips back below 77.40, the market would be telling us the breakout attempt lacked follow-through and that the upper band was used as a selling zone.
The key signal is not just the level itself, but how the stock behaves around it. A strong close above resistance would suggest buyers are still in control. A rejection there would fit the softer MACD reading and the lighter volume.
Technical Verdict: HOLD (wait & see)
HOLD (wait & see) — the uptrend is intact, but momentum is not fully confirming the price position near resistance.
- Trend support: price is above the SMA20 at 75.95 and SMA50 at 72.61, with the SMA20 still rising.
- Momentum caution: MACD is below its signal line and the histogram is negative, showing fading acceleration even as price holds up.
- Compression risk: %B at 98% and Bollinger width at 4.5% suggest a move is brewing, but direction is not yet confirmed.
- Verdict invalidated if price breaks below 73.55, which would mean the nearest support has failed.
- Ideal entry range: 75.95 to 77.40, anchored to the SMA20 and resistance zone.
- Exit target: 77.97, the 3-month high and the next visible ceiling in the data.
- Stop loss protection: 73.55, the 20-hour support.
For non-traders: DBS is still trending higher, but the chart is now waiting for proof that buyers can keep pushing instead of just holding the line.
Summary Data DBS
| Last price | 77.60 SGD |
| Change 1 day / 5 days / 1 month | 0.26% / 1.57% / 4.23% |
| Trend / MA-cross | uptrend / none |
| SMA20 / SMA50 | 75.95 / 72.61 |
| RSI (14) / Stochastic %K | 60.7 / 68.7 |
| Bollinger %B / ATR | 98% / 1.12 |
| Support / Resistance 20 days | 73.55 / 77.40 |
| Data as of | 1 September 2026 08:00 WIB |
Track DBS share price daily: live levels, support/resistance and our full DBS analysis history.