Death Cross Pressure, UOB Stock Gains 0.51% Today
On September 3, 2026: price 41.77 SGD, trend sideways, RSI 48.4, support 40.22, resistance 43.58. technical analysis of uob stock. Death Cross Pressure — full…
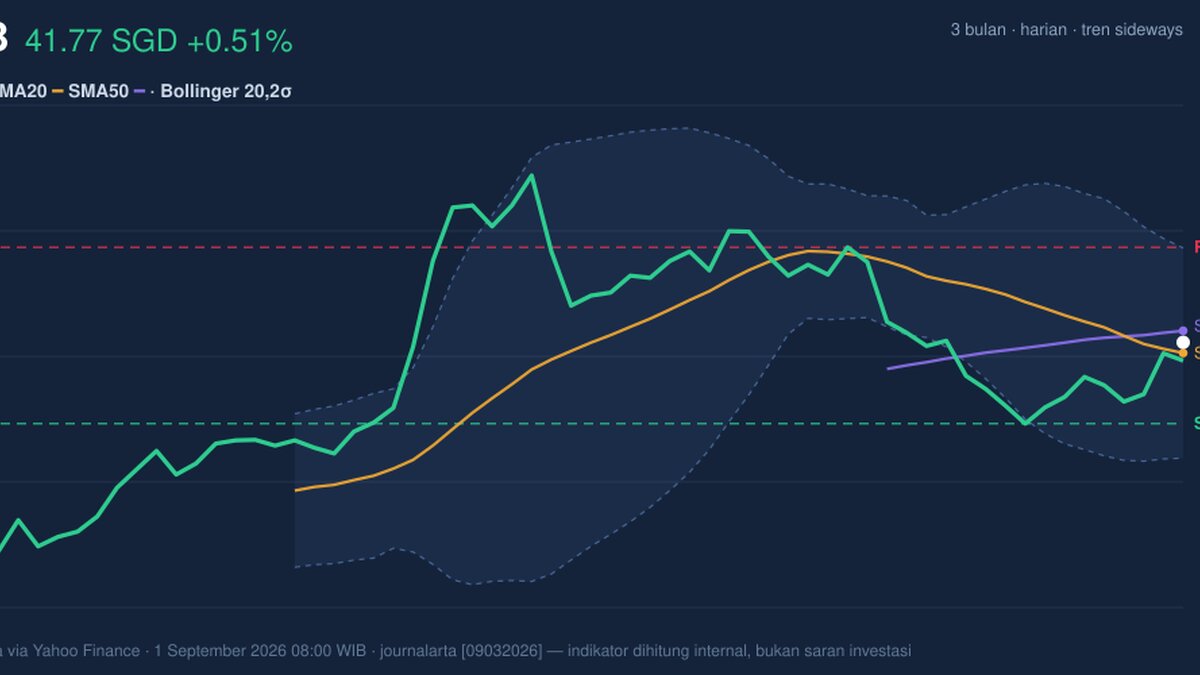
United Overseas Bank edged up to SGD 41.77 on SGX in early trading on 1 September 2026, a modest gain that leaves the counter in a sideways pattern rather than a clean breakout. The move matters less for its size than for where it sits: price is still above the 20-day average at 41.57, but it remains below the 50-day average at 41.99, while the chart shows a death cross already in place. That combination usually signals a market that has not fully repaired its trend, even if buyers are still willing to defend dips.
Trend & Price Action
The broader structure is still best described as range-bound, with the stock trading in the middle of its recent band rather than pressing either extreme. The 20-day moving average is falling, with a -1.42% slope over five days, which tells readers that short-term pressure is still leaning down even though the share price has recovered slightly from the prior close of 41.56. In plain terms, the stock is not collapsing, but it is also not yet showing the kind of sustained lift that would suggest a trend reversal.
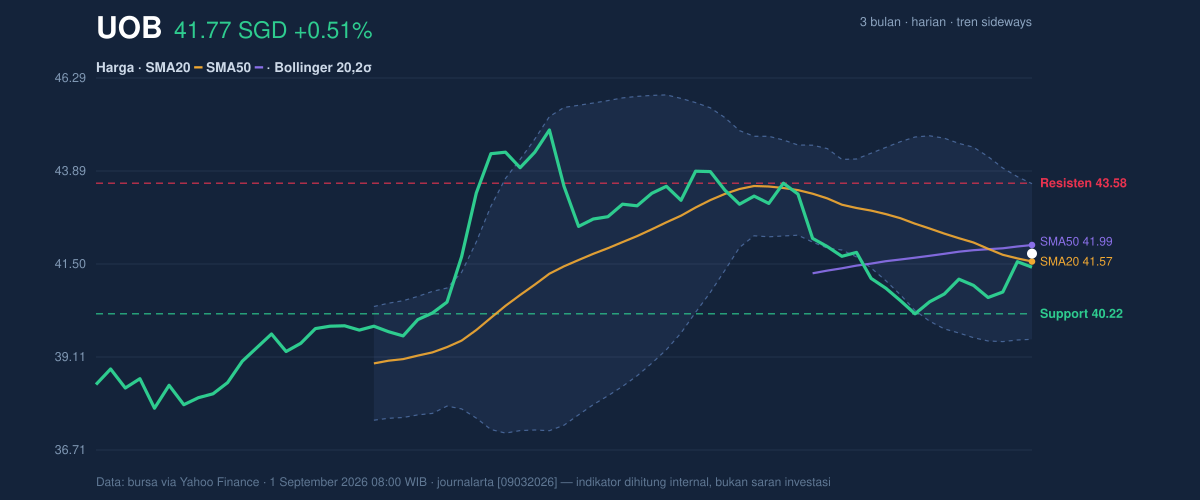
The chart also shows price sitting at about 46% of the 20-day range, which is a neutral placement. That middle-ground position often reflects indecision: sellers have not forced a breakdown, but buyers have not regained enough control to test the upper band with conviction. The 3-month high of 45.15 and 3-month low of 37.52 frame the larger battlefield, and current levels keep UOB closer to the centre than to either edge.
Oscillators & Momentum
Momentum signals are mixed, and that is the key message from the indicators. The RSI at 48.4 is neutral, which means the stock is neither overbought nor oversold and still has room to move in either direction. The Stochastic %K at 74.3 and %D at 57.3 point to firmer short-term momentum than RSI suggests, but not an outright overbought condition; instead, it hints that recent buying has improved, though not enough to confirm a fresh trend.
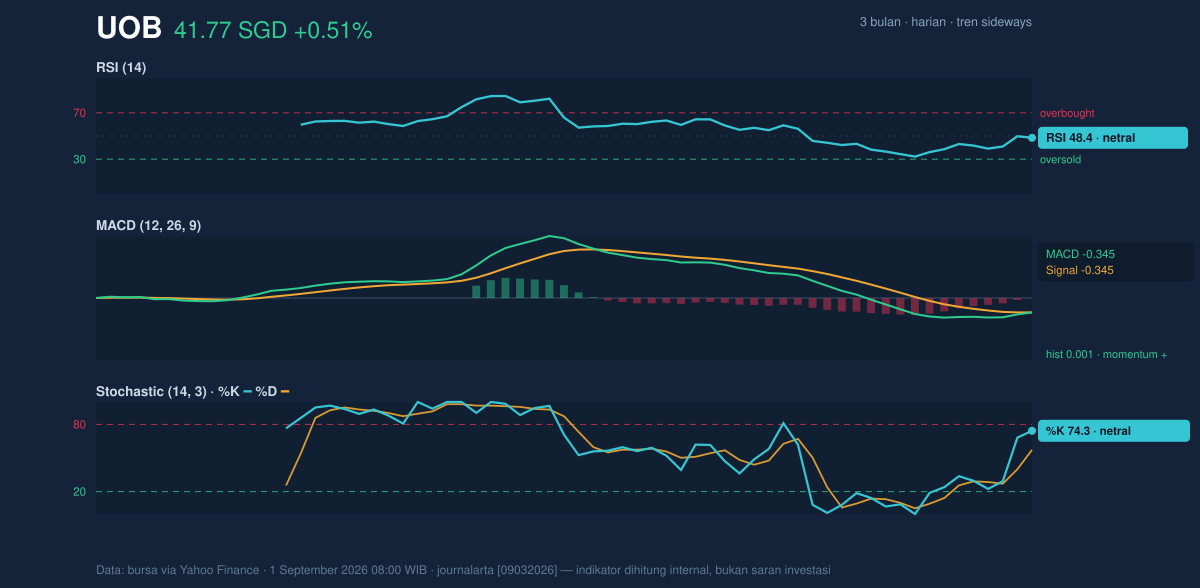
The most constructive piece in this section is the MACD at -0.345 matching the signal line at -0.345 with a positive histogram of 0.001. That tiny positive spread matters because MACD is a trend-following indicator: when the histogram turns positive, it suggests downward momentum is easing and the market may be trying to stabilise. This is not a strong bullish signal, but it is a sign that the earlier weakness is no longer accelerating.
Volatility & Volume
Volatility is subdued. The ATR at 0.55, or 1.3% of price, indicates relatively low daily movement, and the Bollinger Bands are in a normal 9.6% width rather than a squeeze or expansion. That means the stock is not coiling for an unusually sharp move right now, but it also is not showing panic-style volatility. The %B at 55% places price slightly above the mid-band, which suggests mild upward bias within the current range without reaching the upper band at 43.57.
Volume is supportive but not emphatic. Last trade volume of 3,277,800 is below the 20-day average of 3,667,425, or about 0.9x normal, so the latest rise did not come with strong participation. That matters because advances on light volume can fade quickly if larger investors are not adding exposure. Still, OBV is rising, and that is a useful counterpoint: on-balance volume tracks whether money flow is accumulating over time, so a rising OBV suggests underlying demand has been better than the raw daily volume alone implies.
Key Levels & Scenarios
The nearest support at 40.22 is the line that matters most if the stock loses momentum. A move below that level would suggest the recent stabilisation has failed and could reopen the lower part of the range toward the Bollinger lower band at 39.56. On the upside, resistance at 43.58 sits just above the upper Bollinger band at 43.57, which makes it a meaningful ceiling; a clean move through that area would show the market has absorbed near-term supply and may be ready to challenge the upper end of the broader range.
The current setup therefore looks like a stock trying to base, but still under technical supervision from the death cross. For now, the evidence says the rebound is real enough to notice, yet too modest to declare a trend change.
Technical Verdict: HOLD (wait & see)
HOLD (wait & see)
- Reason 1: price is above SMA20 but below SMA50, so the short-term recovery is not yet strong enough to override the broader downshift.
- Reason 2: MACD histogram is slightly positive, which shows easing downside pressure, but the reading is too small to confirm a durable reversal.
- Reason 3: RSI 48.4 and Bollinger %B 55% both point to a neutral, range-trading market rather than a decisive breakout.
Verdict invalidated if price falls below 40.22, because that would break the nearest support and weaken the current base.
- Ideal Entry Range: 40.22 to 41.57
- Exit Target (Target Price): 43.57 to 43.58
- Stop Loss protection: below 40.22, with the lower Bollinger band at 39.56 as the next technical reference
For non-traders, this means UOB is still moving inside a range, with early signs of stabilisation but not enough evidence yet to say the downtrend has been fully reversed.
Summary Data UOB
| Last price | 41.77 SGD |
| Change 1 day / 5 days / 1 month | 0.51% / 1.61% / -2.95% |
| Trend / MA-cross | sideways / death |
| SMA20 / SMA50 | 41.57 / 41.99 |
| RSI (14) / Stochastic %K | 48.4 / 74.3 |
| Bollinger %B / ATR | 55% / 0.55 |
| Support / Resistance 20 days | 40.22 / 43.58 |
| Data as of | 1 September 2026 08:00 WIB |
Track UOB share price daily: live levels, support/resistance and our full UOB analysis history.