DIS Momentum Weakens: Stock Gains 1.66% (September 3, 2026)
On September 3, 2026: price 107.98 USD, trend uptrend, RSI 58.5, support 101.76, resistance 111.25. technical analysis of dis stock. DIS Momentum Weakens —…
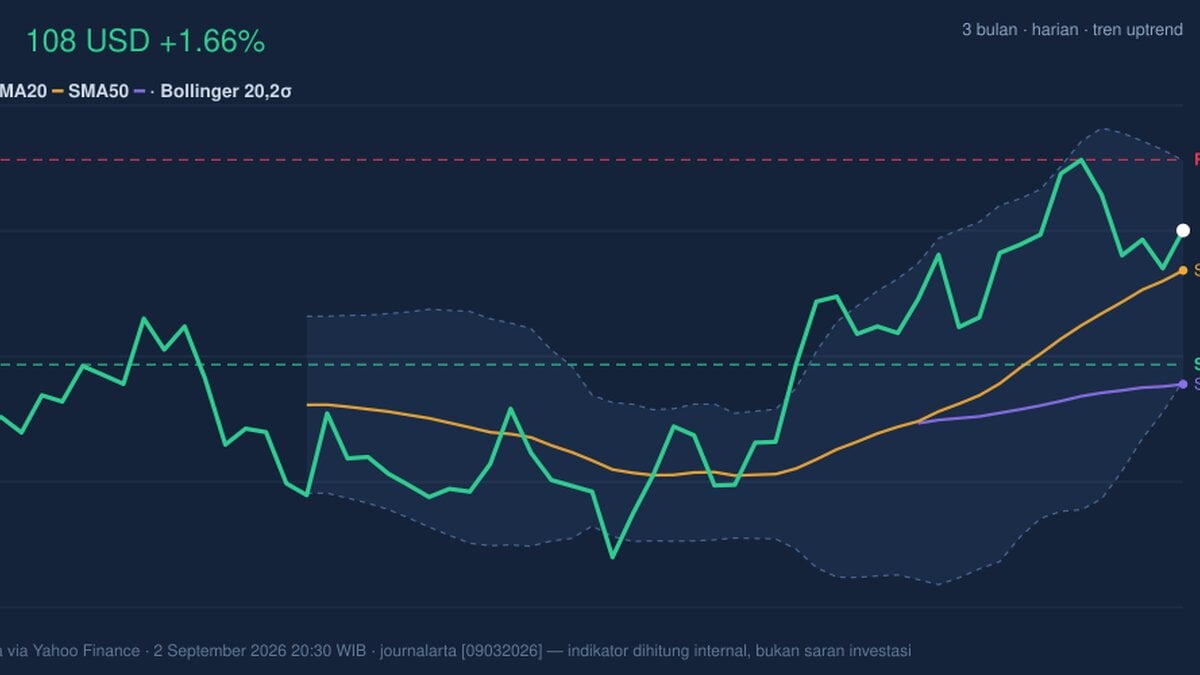
Walt Disney shares rose to 107.98 USD in New York trading on 2 September 2026, up 1.66% on the day, but the move sits inside a more cautious near-term picture: the stock is still below the 111.25 USD resistance and trading only partway through its recent range. The broader setup remains constructive because Disney is above its 20-day SMA at 106.12 and well above the 50-day SMA at 100.85, yet momentum signals are not fully confirming the advance. That gap matters. In technical terms, the trend is still pointing higher, but the latest push has not yet earned full conviction from volume or MACD.
Trend & Price Action
The most important signal in the chart is that Disney remains in an uptrend, with the SMA20 slope at 2.46% over 5 days. A rising short-term average usually means buyers have been willing to pay up over several sessions, and the fact that price is above the SMA20 tells us the stock is holding above its recent equilibrium. The wider structure is also supportive: the shares are comfortably above the SMA50 at 100.85, which indicates the medium-term trend has not broken down.
But the market is not in breakout mode yet. The lack of a fresh MA-cross means there is no new moving-average trigger adding urgency to the move, and the stock is still capped by the 111.25 USD resistance, almost identical to the 3-month high of 111.87. That puts Disney close to the top of its recent trading band, but not through it. The chart suggests a market that is advancing, then pausing to see whether buyers can absorb supply near prior highs.
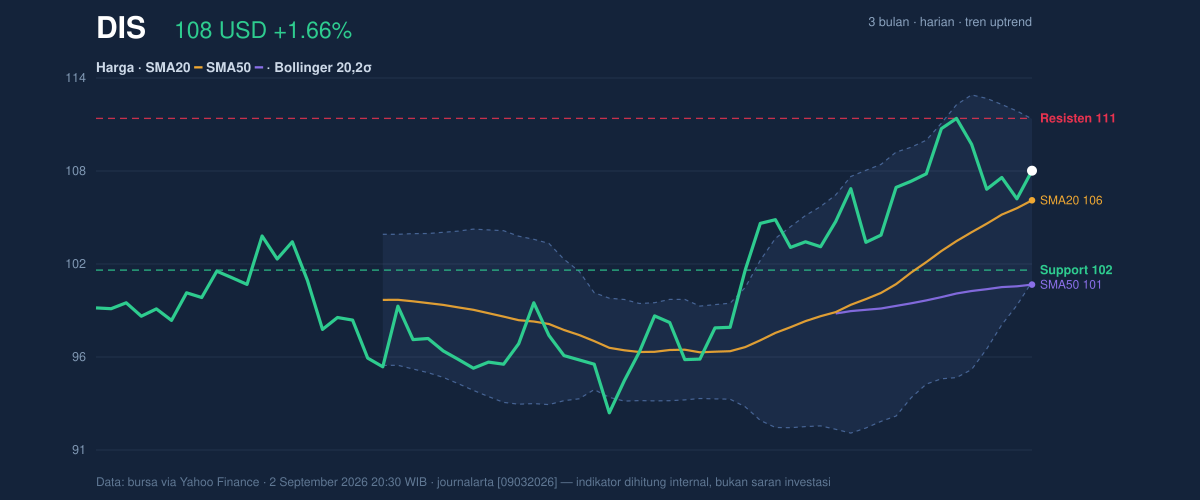
The price is also sitting around 66% of the 20-hour range, which is a useful way to read positioning: not stretched at the ceiling, but no longer near the floor either. That leaves room for either a continuation attempt or a retreat back toward support.
Oscillators & Momentum
The momentum panel is more mixed than the trend chart, as shown in the chart below. RSI at 58.5 is neutral-to-firm, which means Disney is not overbought and still has technical room to extend higher. The Stochastic %K at 53.7 and %D at 50.8 are also neutral, suggesting momentum is balanced rather than overheated. In plain language, the stock has not run so far that it must reverse, but it also is not showing the kind of sharp acceleration that often accompanies a decisive breakout.
The more cautionary signal is the MACD at 2.229 below its signal line at 2.374, with a histogram of -0.145. MACD is a trend-following momentum tool, and when it slips below the signal line, it often means the pace of the advance has slowed even if price itself is still rising. That is the key tension in Disney right now: the trend is upward, but the momentum engine is not firing as strongly as the price action alone might suggest.
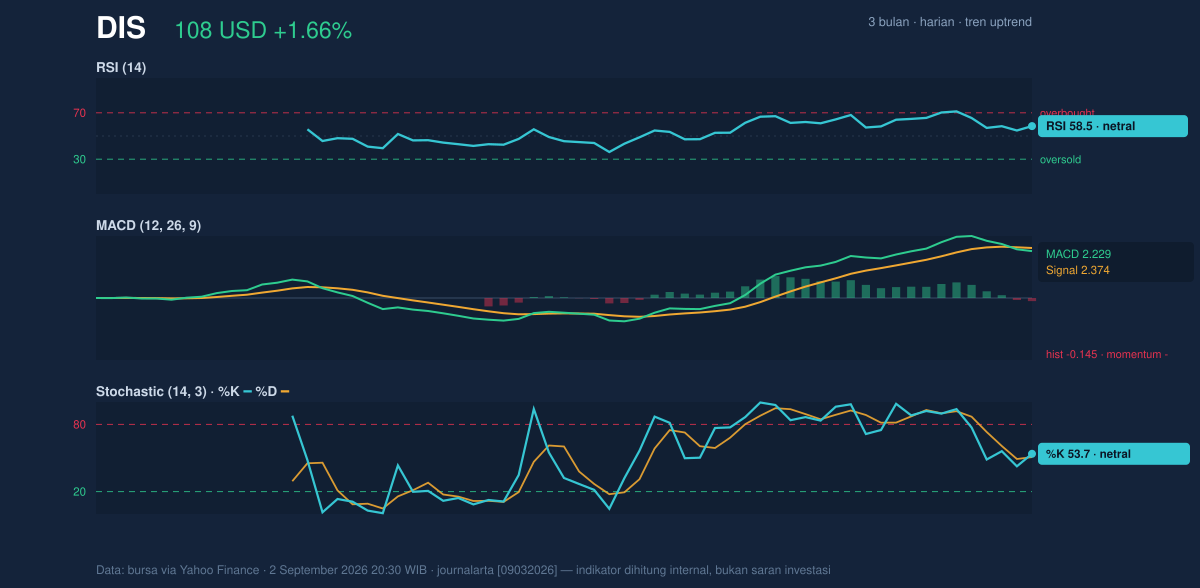
That divergence does not automatically mean reversal. It does mean the stock may need either stronger participation or a cleaner price break above resistance to convert the current uptrend into something more durable.
Volatility & Volume
Disney’s Bollinger Bands help frame the current setup. Price is trading with %B at 68%, which places it in the upper half of the band structure but not at an extreme. The upper band at 111.22 sits just above resistance, reinforcing the idea that the next technical hurdle is close by. Meanwhile, the band width of 9.6% is normal, not compressed. That matters because a squeeze is often a precursor to a sharp move; here, the market is not showing that kind of coiled spring condition. Instead, volatility is moderate and orderly.
The ATR at 2.41, or 2.2% of price, confirms that the stock is moving with medium-sized daily swings rather than unusually large ones. For traders, that means breakouts or pullbacks may still be contained unless volume expands.
Volume is the other missing piece. The latest session traded 7,555,300 shares, below the 20-day average of 8,989,220, or about 0.8x normal. That is not the signature of an aggressive breakout. Still, the OBV is rising, which is constructive because on-balance volume tracks whether volume is accumulating over time. Rising OBV says the stock has been attracting net buying interest even if the latest session was not especially heavy. In other words, participation is positive on balance, but not yet emphatic.
Key Levels & Scenarios
The market’s immediate map is clear. Support at 101.76 is the first line that matters, while resistance at 111.25 is the ceiling to watch. If Disney clears that resistance with better participation, the chart would be signaling a move toward the upper end of the recent structure, with the 111.22 upper Bollinger band and the 3-month high at 111.87 acting as the next reference zone. If it fails to hold above support, the stock could drift back toward the SMA20 at 106.12 and then the SMA50 at 100.85, where trend quality would be tested more seriously.
The key signal is simple: the stock is constructive, but not yet decisive.
Technical Verdict: HOLD (wait & see)
HOLD (wait & see)
- Trend is positive: price is above the SMA20 and SMA50, with the SMA20 slope rising 2.46% over 5 days.
- Momentum is not fully confirmed: MACD is below its signal line and the histogram is negative, which argues for patience.
- Volume is below average: the latest trade came on 0.8x normal volume, so the move lacks strong participation.
- Verdict invalidated if price breaks below 101.76 USD, which would weaken the current support structure.
- Ideal Entry Range: 106.12 to 101.76 USD
- Exit Target: 111.25 to 111.87 USD
- Stop Loss protection: below 101.76 USD
For non-traders: Disney’s chart is still leaning upward, but the latest rise needs stronger confirmation before it can be treated as a cleaner technical move.
“It’s a market that wants to go higher, but it hasn’t yet proved it can stay there.”
Summary Data DIS
| Last price | 107.98 USD |
| Change 1 day / 5 days / 1 month | 1.66% / -2.94% / 9.98% |
| Trend / MA-cross | uptrend / none |
| SMA20 / SMA50 | 106.12 / 100.85 |
| RSI (14) / Stochastic %K | 58.5 / 53.7 |
| Bollinger %B / ATR | 68% / 2.41 |
| Support / Resistance 20 days | 101.76 / 111.25 |
| Data as of | 2 September 2026 20:30 WIB |
Track DIS stock price daily: live levels, support/resistance and our full DIS analysis history.