HSBC Momentum Weakens: Stock Gains 1.10% (September 3, 2026)
On September 3, 2026: price 1,545.20 GBp, trend sideways, RSI 54.1, support 1,497.20, resistance 1,584.60. technical analysis of hsbc stock.
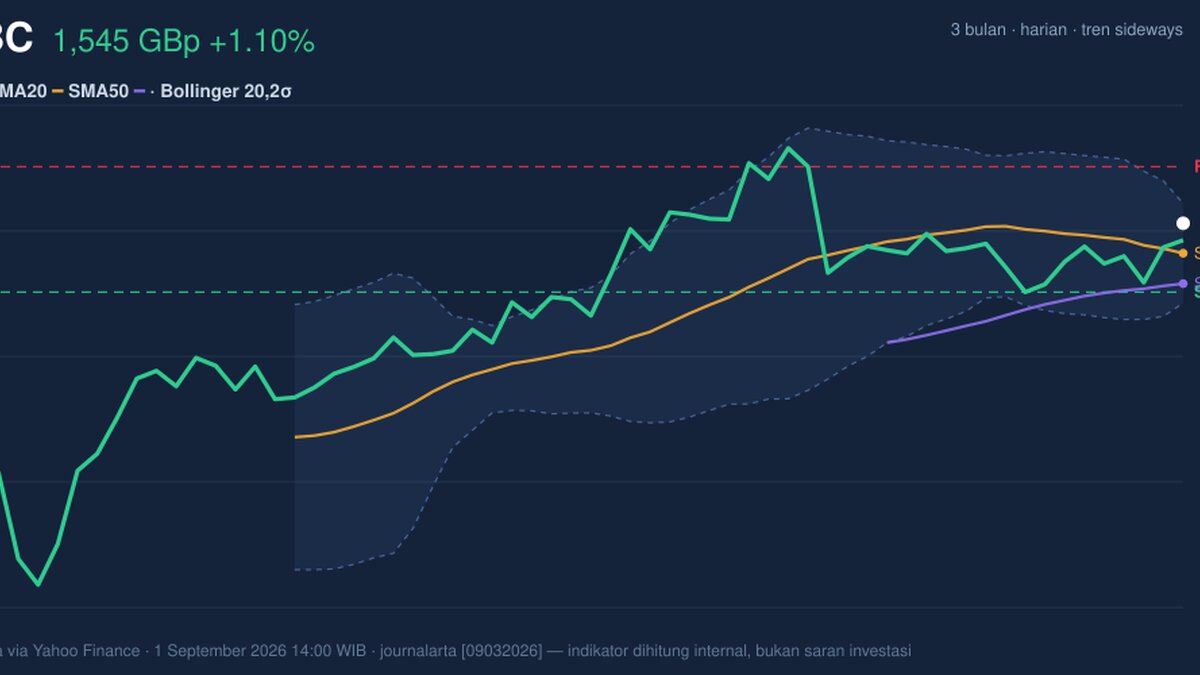
HSBC Holdings traded at 1,545.20 GBp on the LSE on 1 September 2026 at 14:00 WIB, up 1.10% on the day and back above both its SMA20 at 1,524.27 and SMA50 at 1,503.14. That is a constructive short-term signal, but the chart still shows a market that is not yet fully convinced: price is rising inside a sideways trend, momentum is mixed, and the Bollinger Bands are narrowing, which often means traders are waiting for a larger move rather than a steady drift.
Trend & Price Action
As shown in the chart, HSBC is trading in the upper half of its recent range, with price sitting at about 55% of the 20-hour range between 1,497.20 support and 1,584.60 resistance. That placement matters because it shows the share price has recovered enough to reclaim short-term moving averages, but it has not yet broken through the ceiling that would confirm stronger follow-through. The stock is also still below its 3-month high of 1,610.00, while remaining well above the 3-month low of 1,267.20, which frames the broader market as recovering but not trending aggressively.
The absence of a fresh MA-cross suggests the moving-average picture has not delivered a decisive new trend signal. In practical terms, the market is not seeing a clean acceleration from the averages yet; instead, price is hovering above them while the SMA20 slope is still negative at -0.82% over 5 days. That is a classic “improving, but not cured” setup.
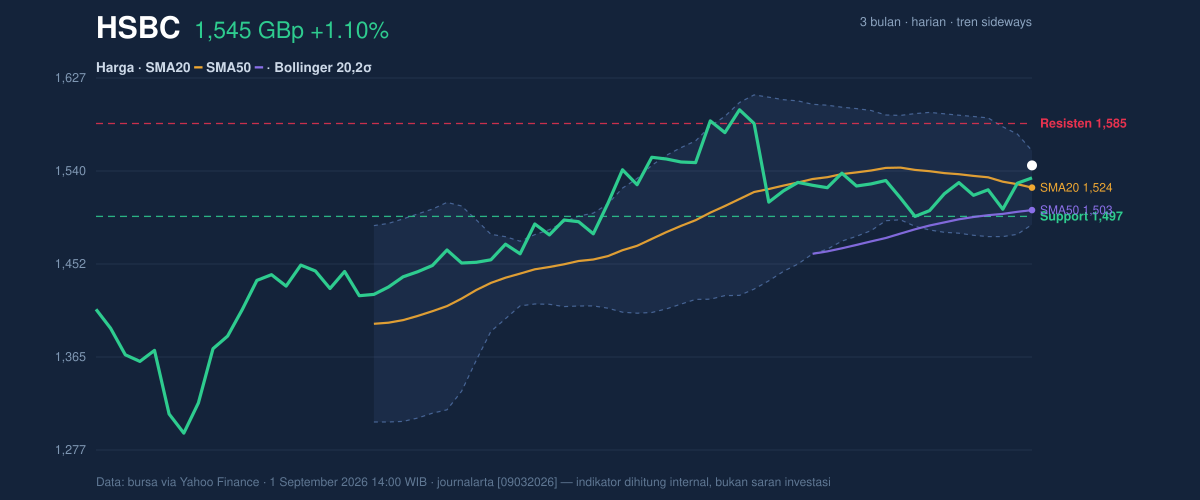
Price above the SMA20 and SMA50 is a positive structure signal, but the still-falling short-term average means recent strength has not fully reversed the prior softness. If HSBC can hold above the 1,524.27 SMA20, the chart preserves its near-term recovery tone. If it slips back below that line, the move starts to look like a rebound inside a broader range rather than the start of a more durable advance.
Oscillators & Momentum
The oscillators are telling a more cautious story. RSI at 54.1 is neutral, which means the stock is neither overbought nor oversold and still has room to move in either direction. Stochastic %K at 76.2 versus %D at 53.4 points to firmer short-term price pressure, but not a confirmed breakout signal; it shows the stock has moved up quickly enough to approach the upper end of its recent rhythm without yet proving that the move can sustain itself.
The main warning comes from the MACD. With MACD at 3.092 below the signal line at 5.048 and a histogram of -1.956, momentum is still negative even though price has improved. That gap between price and momentum is important: it means the share price is rising, but the underlying speed of that rise has not fully caught up. In technical terms, it is a mild divergence that often keeps rallies contained unless volume and price both strengthen together.
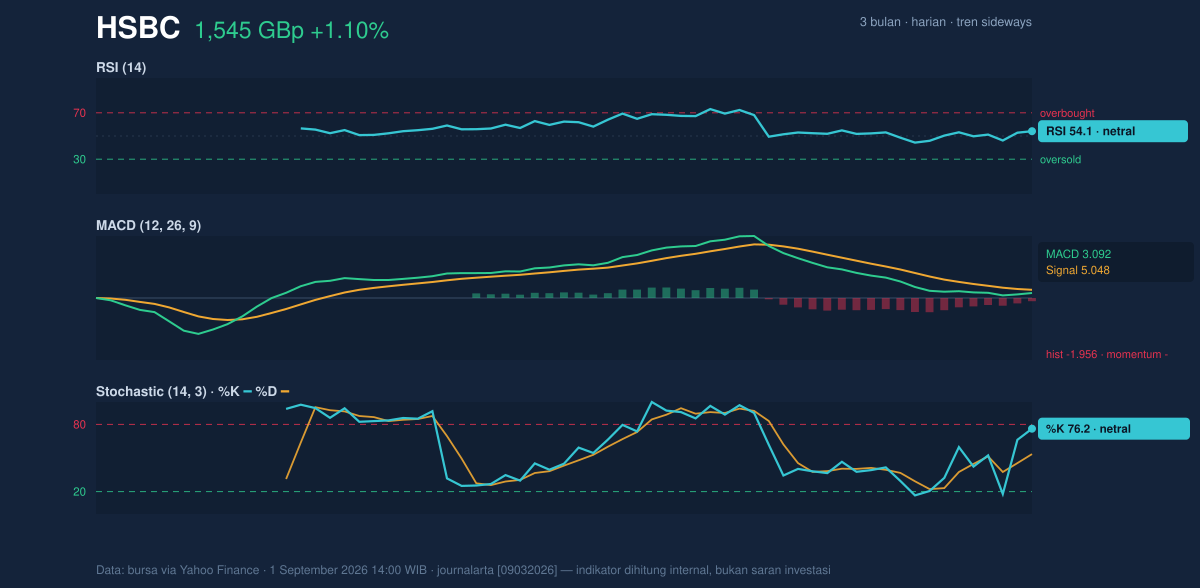
RSI is neutral, Stochastic is elevated but not decisive, and MACD remains negative. Put together, those signals say HSBC is recovering, but the move is not yet broad or forceful enough to declare a clean momentum breakout.
Volatility & Volume
The volatility picture is more interesting than the momentum read. The Bollinger Bands are relatively tight, with the upper band at 1,559.00, the middle band at 1,524.27, and the lower band at 1,489.54. A 4.6% band width is narrow, and the chart description of a squeeze matters because squeezes often precede a directional expansion. In plain language, the market is compressing energy; the next move may be larger than the recent day-to-day drift.
Price at a %B of 80% means HSBC is trading near the upper part of the Bollinger envelope, so the stock is pressing into the top of its recent volatility range. That is constructive, but it also means the share price is near an area where traders may test conviction. A move through the upper band would signal stronger expansion; failure there would leave the stock vulnerable to fading back toward the middle band.
Volume supports the move, but only modestly. Last volume was 26,573,165, almost exactly in line with the 20-hour average of 26,161,325, or about 1.0x normal. That is enough to say the rally is not happening on empty participation, but not enough to argue that buyers have suddenly overwhelmed supply. The positive note is that OBV is rising, which suggests accumulated buying interest has been building even if the latest session did not come with a dramatic volume surge.
ATR at 24.54, equal to 1.6% of price, points to moderate volatility. Combined with the squeeze, that tells readers the stock may be setting up for a larger move even though the current daily range is still manageable.
Key Levels & Scenarios
1,497.20 is the key near-term support to watch, because it is the lower end of the recent range and sits below the SMA20. A clean hold above that level keeps the rebound intact. 1,559.00 marks the upper Bollinger band, while 1,584.60 is the more important resistance from the 20-hour range. A move through that zone would suggest the squeeze is resolving to the upside and that price is challenging the upper edge of its recent structure.
If HSBC fails to hold 1,524.27, the SMA20, the price action would lose some of its short-term recovery credibility and could drift back toward 1,497.20. If it clears 1,584.60, the chart would start to look less like a sideways consolidation and more like an attempt to retest the 1,610.00 3-month high.
Technical Verdict: HOLD (wait & see)
HOLD (wait & see) because the structure is improving, but not yet confirmed.
- Price is above the SMA20 and SMA50, which supports the short-term recovery.
- MACD remains negative, showing momentum has not fully caught up with price.
- Bollinger Bands are squeezing, which often precedes a breakout but does not reveal direction on its own.
Verdict invalidated if price breaks below 1,497.20, the nearest range support.
Ideal entry range: 1,524.27 to 1,497.20
Exit target: 1,559.00 to 1,584.60
Stop loss protection: below 1,497.20
In plain English, HSBC looks steadier than it did a few sessions ago, but the chart still needs confirmation before the move can be treated as more than a rebound.
HSBC 20-hour resistance stands at 1,584.60, with the 3-month high at 1,610.00.
Summary Data HSBC
| Last price | 1,545.20 GBp |
| Change 1 day / 5 days / 1 month | 1.10% / 1.06% / -3.27% |
| Trend / MA-cross | sideways / none |
| SMA20 / SMA50 | 1,524.27 / 1,503.14 |
| RSI (14) / Stochastic %K | 54.1 / 76.2 |
| Bollinger %B / ATR | 80% / 24.54 |
| Support / Resistance 20 days | 1,497.20 / 1,584.60 |
| Data as of | 1 September 2026 14:00 WIB |
Track HSBC share price daily: live levels, support/resistance and our full HSBC analysis history.