HSBC Testing Key Resistance: Stock Gains 0.99% (September 3, 2026)
On September 3, 2026: price 162.60 HKD, trend sideways, RSI 49.0, support 160.10, resistance 163.50. technical analysis of hsbc stock. HSBC Testing Key…
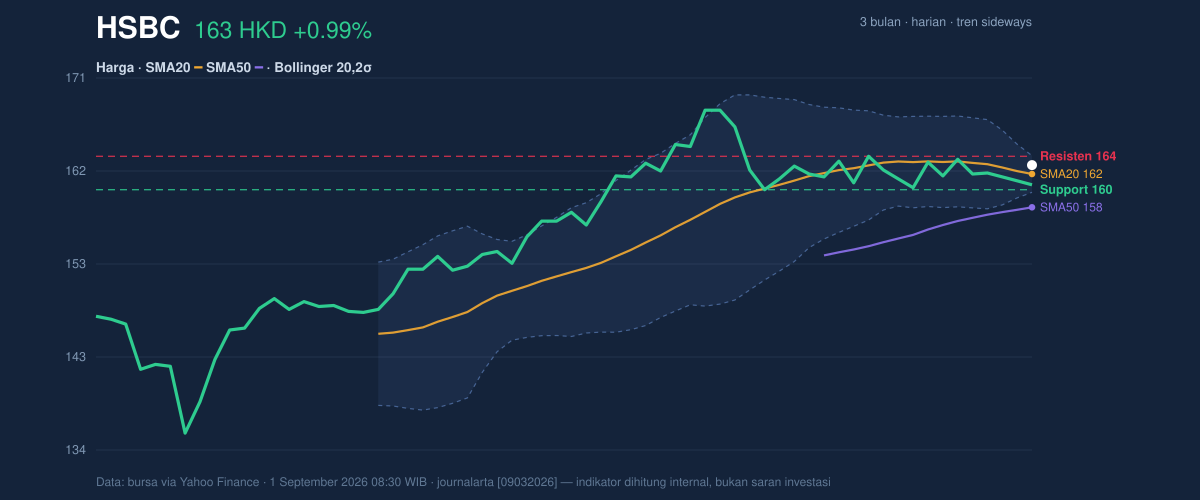
HSBC Holdings traded at 162.60 HKD on HKEX, up 0.99% from the previous close of 161.00, but the bigger message in the chart is that the shares are still stuck in a sideways pattern. The price is holding above the SMA20 at 161.70 and comfortably above the SMA50 at 158.31, which keeps the medium-term structure intact, yet the short-term slope of the SMA20 remains negative at -0.79% over 5 days. That combination usually signals a market that is stabilising rather than accelerating: buyers are present, but they have not yet forced a clean trend change.
Trend & Price Action
As shown in the chart, HSBC is trading in the upper part of its recent band, with the price at 74% of the 20-hour range and just below the 20-day Bollinger upper band at 163.56. That positioning matters because it shows the stock has recovered enough to test overhead supply, but not enough to break out decisively. The lack of a fresh MA-cross also tells the same story. A “golden cross” or “death cross” is a moving-average crossover that can signal a major trend shift; here, there is no new crossover, so the chart is still waiting for confirmation.
The broader range also frames the move. HSBC is well above the 3-month low of 133.50, but still below the 3-month high of 169.70. That leaves the stock in the middle of a wide multi-month corridor, where rallies often stall near resistance unless volume and momentum improve.
A short move higher is possible, but the market has not yet proved it can hold above nearby resistance.
Oscillators & Momentum
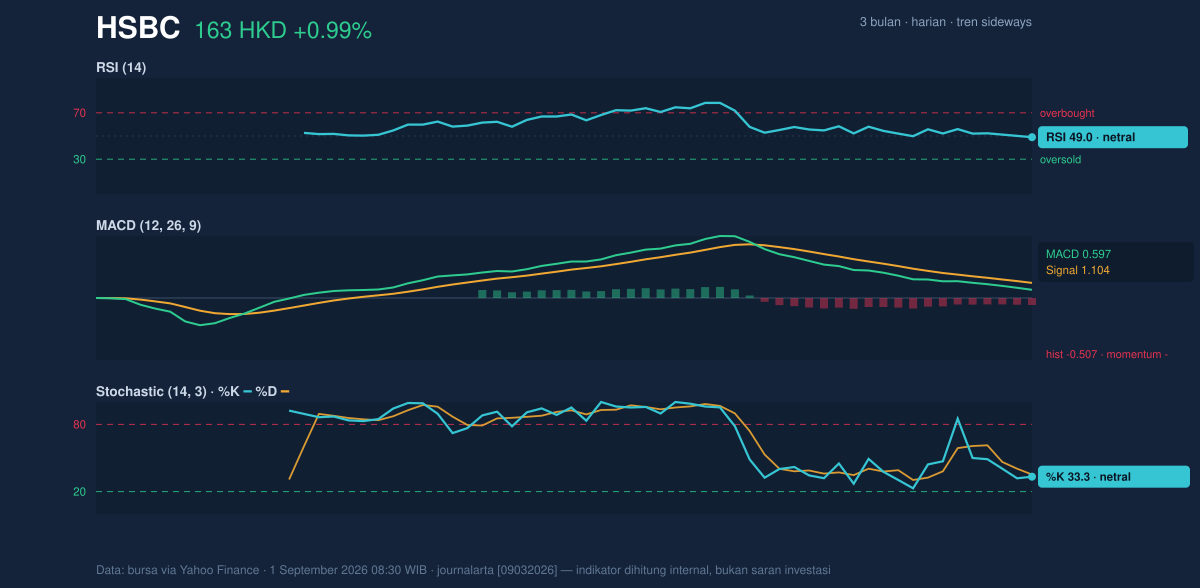
The momentum picture is mixed rather than bullish. RSI at 49.0 is neutral, which means the stock is neither overbought nor oversold and is essentially balanced between buyers and sellers. Stochastic %K at 33.3 and %D at 35.2 also sit in neutral territory, but they are closer to the lower half of the scale, suggesting momentum has improved from weakness without yet turning emphatically upward. In plain language, the stock is no longer stretched on the downside, but it has not generated the kind of thrust that usually accompanies a stronger breakout.
The most important caution comes from MACD. MACD at 0.597 is below its signal line at 1.104, leaving a -0.507 histogram. A negative histogram means the shorter-term trend is lagging the longer-term trend, so the recent bounce is not yet strong enough to flip the momentum backdrop. That matters because price can drift higher inside a range while momentum remains soft; until MACD turns back above the signal line, the rally lacks full technical confirmation.
This is the kind of setup that often produces hesitation near resistance.
Volatility & Volume
Volatility is subdued. HSBC’s ATR(14) of 2.28, equal to 1.4% of price, indicates relatively low day-to-day movement. When ATR is low and Bollinger Bands are tightening, the market is often coiling for a larger move, but the direction is not guaranteed. Here, the Bollinger band width of 2.3% is described as a squeeze, which means the price has been compressing inside a narrower range. That usually raises the odds of a breakout or breakdown once one side gives way.
At the same time, volume is only moderately supportive. The latest turnover of 11,434,136 shares is about 1.2× normal versus the 20-hour average of 9,701,059, so participation is better than average but not explosive. More importantly, OBV is falling. On-balance volume tracks whether trading volume is accumulating on up days or being distributed on down days. A falling OBV while price holds up can mean the rally is not being broadly supported by capital flow, which weakens the case for an immediate upside break.
The chart is tight, but the volume signal is not fully backing the move.
Key Levels & Scenarios
The nearest support is 160.10, while resistance sits at 163.50. That narrow band is crucial because HSBC is already trading near the upper end of the range, and the price at 162.60 is close enough to resistance that the next move matters more than the last one. If the shares can clear 163.50 with better volume and a firmer MACD turn, the chart would begin to argue for continuation toward the upper Bollinger band at 163.56 and then the broader 3-month high zone at 169.70. If instead the price fails to hold 160.10, the bounce would look less like a base-building phase and more like a pause inside a larger sideways drift.
The key signal is not the day’s gain; it is whether the stock can convert a narrow squeeze into a real breakout.
Technical Verdict: HOLD (wait & see)
HOLD (wait & see) because the chart is constructive but not decisive: price is above SMA20 and SMA50, Bollinger Bands are squeezing, and volume is slightly above average, yet MACD remains below its signal line and OBV is declining, which weakens confirmation. The verdict is invalidated if price falls below 160.10, because that would break the nearest support and suggest the current recovery is losing traction.
- Ideal Entry Range: 160.10 to 161.70
- Exit Target (Target Price): 163.50 to 163.56
- Stop Loss protection: below 160.10
In plain English: HSBC is holding its ground, but the chart still needs proof that the next move is upward rather than just another trade inside a tight range.
Summary Data HSBC
| Last price | 162.60 HKD |
| Change 1 day / 5 days / 1 month | 0.99% / -0.37% / -2.34% |
| Trend / MA-cross | sideways / none |
| SMA20 / SMA50 | 161.70 / 158.31 |
| RSI (14) / Stochastic %K | 49.0 / 33.3 |
| Bollinger %B / ATR | 74% / 2.28 |
| Support / Resistance 20 days | 160.10 / 163.50 |
| Data as of | 1 September 2026 08:30 WIB |
Track HSBC share price daily: live levels, support/resistance and our full HSBC analysis history.