MA Stock Analysis: Gains 1.21%, Momentum Weakens
On September 3, 2026: price 588.14 USD, trend uptrend, RSI 61.1, support 559.73, resistance 599.86. technical analysis of ma stock. MA Stock Analysis — full…
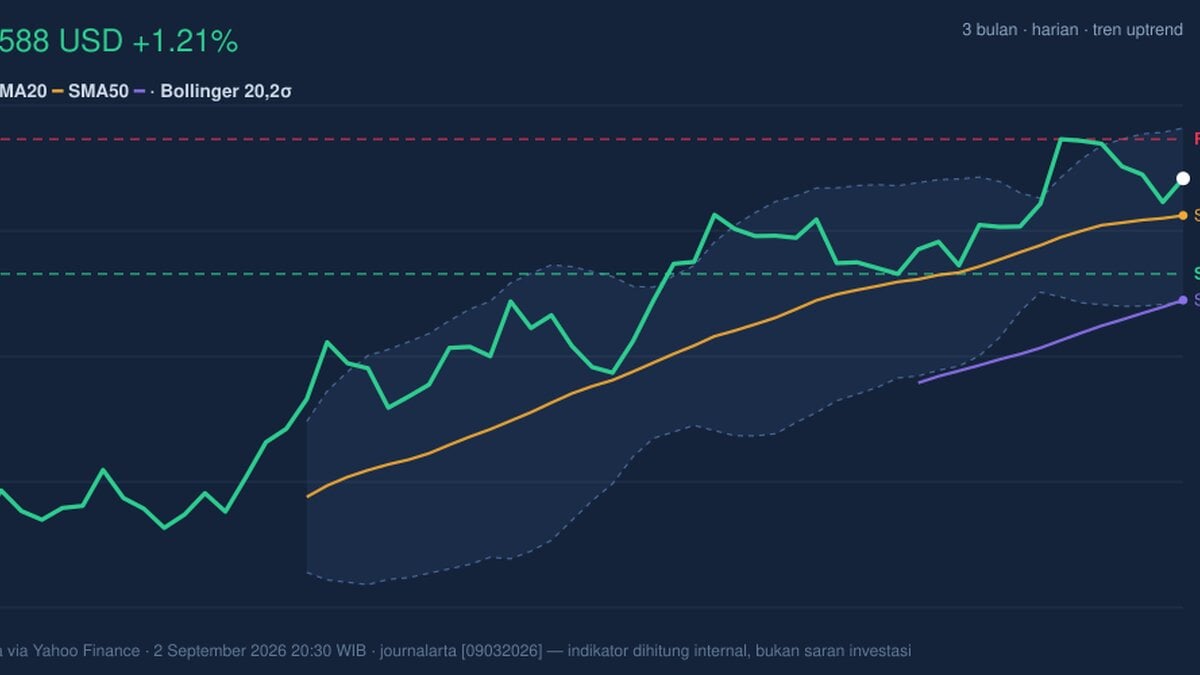
Mastercard’s shares on the NYSE last traded at 588.14 dollars, up 1.21% on the day, according to Yahoo Finance data cited by the exchange feed, but the move sits inside a more cautious short-term tape: the stock is still 1.87% lower over 5 days even as it has gained 2.98% over 1 month. That mix matters. It says the broader trend is still constructive, yet recent buyers have not been able to turn momentum into a clean breakout, leaving the stock hovering in the upper part of its 20-day range rather than racing away from it.
Trend & Price Action
The chart shows Mastercard trading above both its SMA20 at 577.14 and SMA50 at 551.94, which keeps the primary bias pointed upward. Just as important, the SMA20 slope of 0.81% over 5 days signals that the short-term trend is still rising rather than flattening out. In plain terms, the average price over the past month is moving higher, so pullbacks have so far been treated as pauses, not breakdowns. There is no new MA-cross, meaning the stock is not in the kind of fresh moving-average signal that often accompanies a major trend change; instead, it is in a mature uptrend that needs continued confirmation.
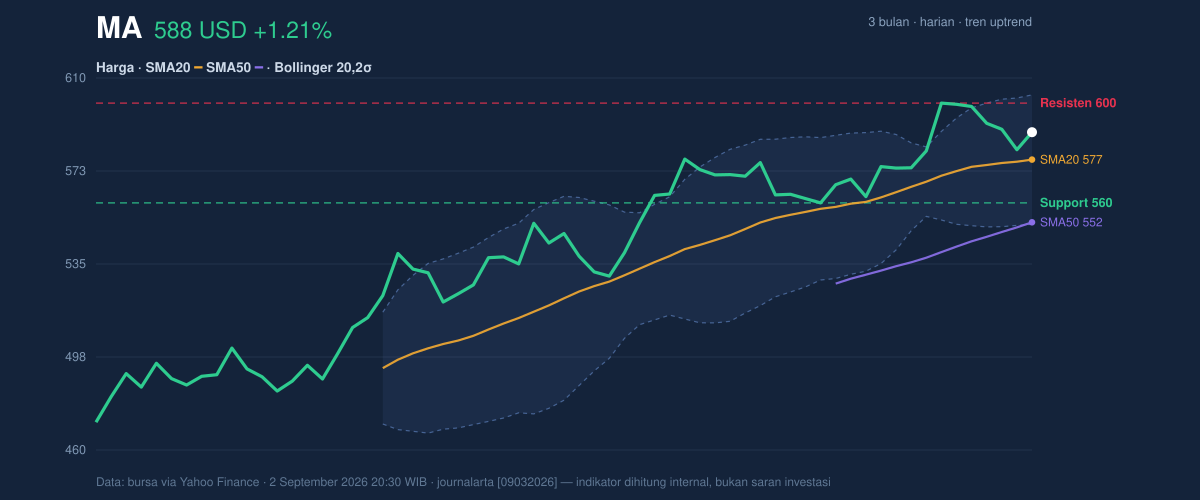
That maturity is visible in the range position. Mastercard is sitting at about 71% of its 20-day range, with 20-hour support at 559.73 and 20-hour resistance at 599.86. Being near the upper end of the range suggests the market is willing to pay up, but not yet willing to chase aggressively through resistance. The broader 3-month band — 601.23 on the high side and 464.52 on the low side — shows the stock has already recovered a large share of its prior drawdown, which reinforces the idea that the market is now testing whether this advance can extend into a new leg rather than merely rebound from oversold conditions.
It is advancing, but not convincingly breaking free.
Oscillators & Momentum
Momentum indicators are more mixed than the trend line. The RSI at 61.1 is neutral, which usually means the stock is neither stretched enough to be considered overbought nor weak enough to suggest capitulation. The Stochastic %K at 69.9 and %D at 66.3 are also neutral, but they sit close to the upper end of the range, implying price is still carrying upward pressure without flashing an exhaustion signal. That combination is important: it tells readers that the stock has room to continue rising, but it is no longer in an early-stage momentum burst.
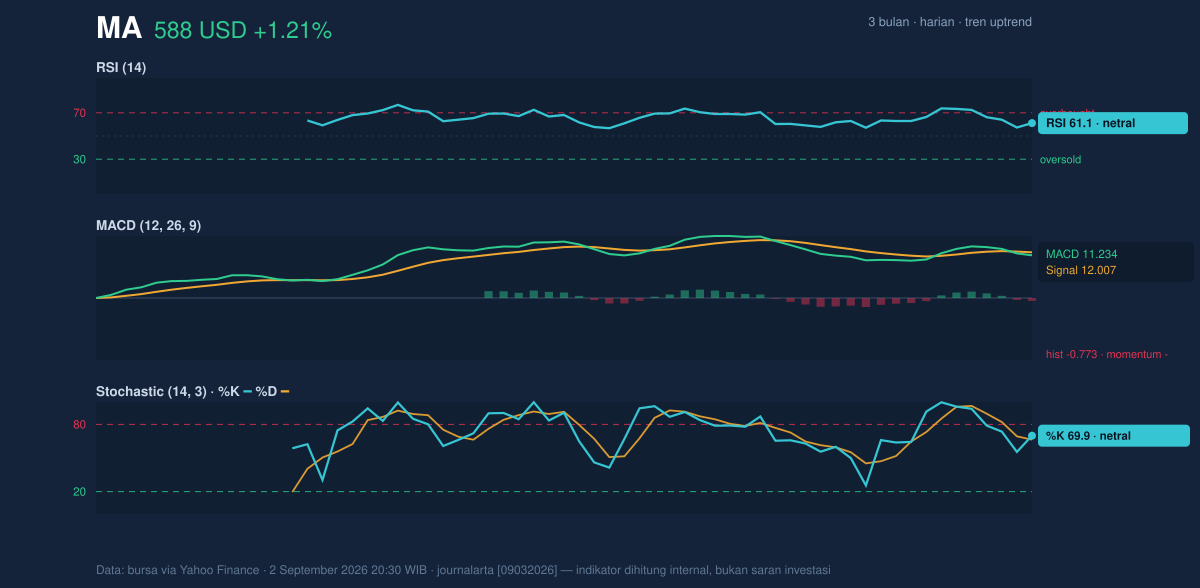
The more cautionary signal comes from MACD at 11.234 versus its signal line at 12.007, with a -0.773 histogram. In practical terms, MACD is a trend-following gauge, and when the main line sits below the signal line, it suggests momentum is cooling even if price has not yet rolled over. That is the key tension in Mastercard right now: price is above its moving averages, but the internal thrust has softened. The chart is telling us the trend is alive, yet the engine is not accelerating.
Volatility & Volume
Volatility is still contained. Mastercard’s Bollinger Bands are set at 603.15 on the upper band, 577.14 at the middle band, and 551.13 on the lower band, with %B at 71% and a 9.0% band width. A normal band width means the stock is not in a volatility squeeze, where price often builds pressure for a sharp move, nor is it in an extreme expansion phase. The %B reading above 50% shows the stock is trading in the upper half of its volatility envelope, which fits the broader uptrend, but it also means the next leg needs fresh demand to push toward the upper band and beyond.
Volume does not yet provide that confirmation. Last volume was 2,290,400 versus a 20-day average of 2,873,530, or 0.8× normal, and OBV is down. OBV, or on-balance volume, tracks whether volume is flowing into the stock or out of it; a falling reading while price holds up can mean the rally is lacking broad participation. That does not automatically imply weakness, but it does suggest the recent advance is not being backed by the strongest possible accumulation. In a stock near resistance, that matters.
Key Levels & Scenarios
The immediate technical map is straightforward. Support at 559.73 is the first level that matters if the stock loses traction, because it sits below the 20-day average and near the lower part of the recent trading band. A failure there would raise the odds of a deeper retracement toward the 551.13 Bollinger lower band and the 551.94 SMA50 area, which would tell the market that the short-term uptrend is losing its grip. On the upside, 599.86 is the first resistance to clear, with the 603.15 upper Bollinger band acting as the next technical ceiling. A push through that zone would signal that buyers are willing to absorb supply near the top of the range and could improve the case that momentum is re-accelerating.
At the same time, the current setup is not showing the kind of volume expansion that usually accompanies a clean breakout. So the signal is less about dramatic upside and more about whether the stock can hold its elevated base long enough for momentum to catch up.
Technical Verdict: HOLD (wait & see)
HOLD (wait & see) because the trend remains positive above the SMA20 and SMA50, but MACD is negative versus its signal line, volume is below average, and OBV is falling, which weakens confirmation of the move. The RSI at 61.1 and Stochastic near the upper end of neutral show strength without urgency, while price is still below the 599.86 resistance and 603.15 upper Bollinger band.
- Ideal Entry Range: 577.14 to 559.73
- Exit Target: 599.86 to 603.15
- Stop Loss protection: below 551.13
This verdict is invalidated if price falls below 559.73 and then loses the 551.13 lower Bollinger band area.
For non-traders, that means Mastercard still looks technically healthy, but the market has not yet proved that the latest rise has enough force to keep going.
“The chart is asking for proof, not applause.”
Summary Data MA
| Last price | 588.14 USD |
| Change 1 day / 5 days / 1 month | 1.21% / -1.87% / 2.98% |
| Trend / MA-cross | uptrend / none |
| SMA20 / SMA50 | 577.14 / 551.94 |
| RSI (14) / Stochastic %K | 61.1 / 69.9 |
| Bollinger %B / ATR | 71% / 10.02 |
| Support / Resistance 20 days | 559.73 / 599.86 |
| Data as of | 2 September 2026 20:30 WIB |
Track MA stock price daily: live levels, support/resistance and our full MA analysis history.