META Stock Gains 2.47% Today, Testing Key Resistance
On September 3, 2026: price 592.85 USD, trend sideways, RSI 54.9, support 543.67, resistance 599.12. technical analysis of meta stock. META Stock Gains — full…
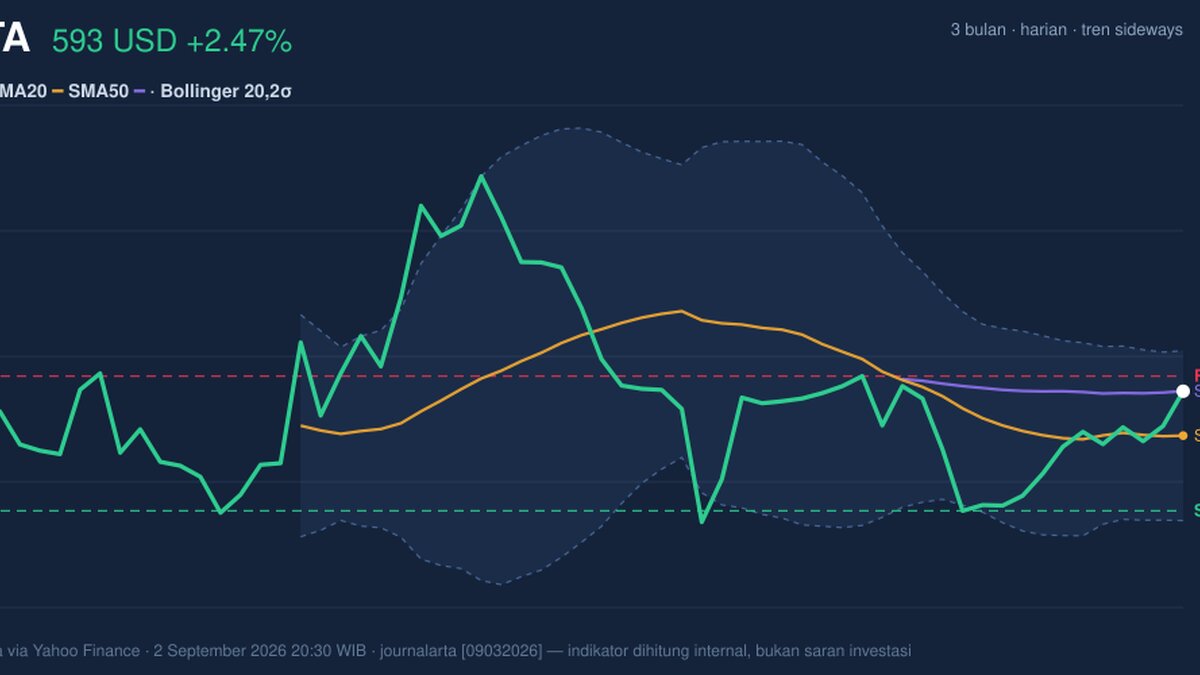
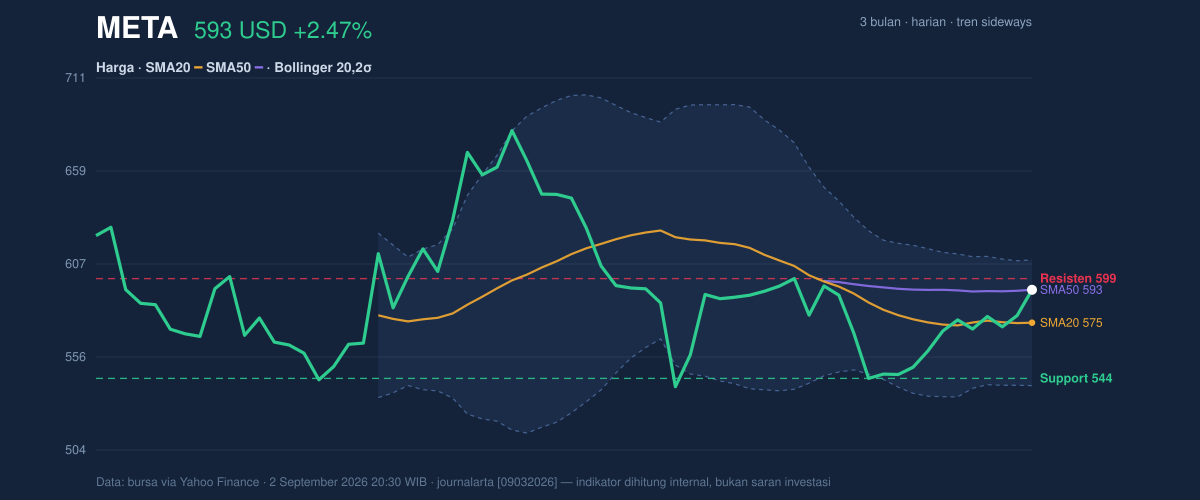
Meta Platforms opened the latest session at 592.85 dollars, up 2.47% from the previous close of 578.54, and the move matters less as a headline than as a test of where the stock sits inside a tightening range. The shares are now trading just below SMA50 at 592.95 while remaining above SMA20 at 574.61, a setup that suggests the medium-term trend has not broken, but it has not yet regained full upward control either. As shown in the chart, the price is pressing into the upper half of its recent band rather than escaping it, which is often where momentum either confirms or stalls.
Trend & Price Action
The broader pattern is still best described as sideways, and that label is important because it means the market is not rewarding either bulls or bears with a clean directional follow-through. The SMA20 slope of 0.26% over 5 days points to mild upward drift, not a strong trend. In plain language, the stock is inching higher, but not fast enough to suggest a decisive breakout regime.
That matters because the price is sitting almost exactly on top of the SMA50 at 592.95. When price and the 50-day average cluster together, the market is often at an inflection point: traders who follow trend signals see it as a line that separates recovery from hesitation. There is no new MA-cross, so the chart does not yet show a fresh long-term trend shift. The absence of a crossover tells readers the recent bounce is still being judged against the prior range, not celebrated as a new phase.
The Bollinger structure reinforces that message. Price is near the upper half of the band, with the upper band at 609.55, the middle at 574.61, and the lower at 539.66. A move toward the upper band usually indicates improving pressure, but the 12.2% band width is only normal, not compressed enough to signal a major volatility breakout. In other words, the stock is leaning upward inside a regular envelope, not coiling for an explosive move.
Oscillators & Momentum
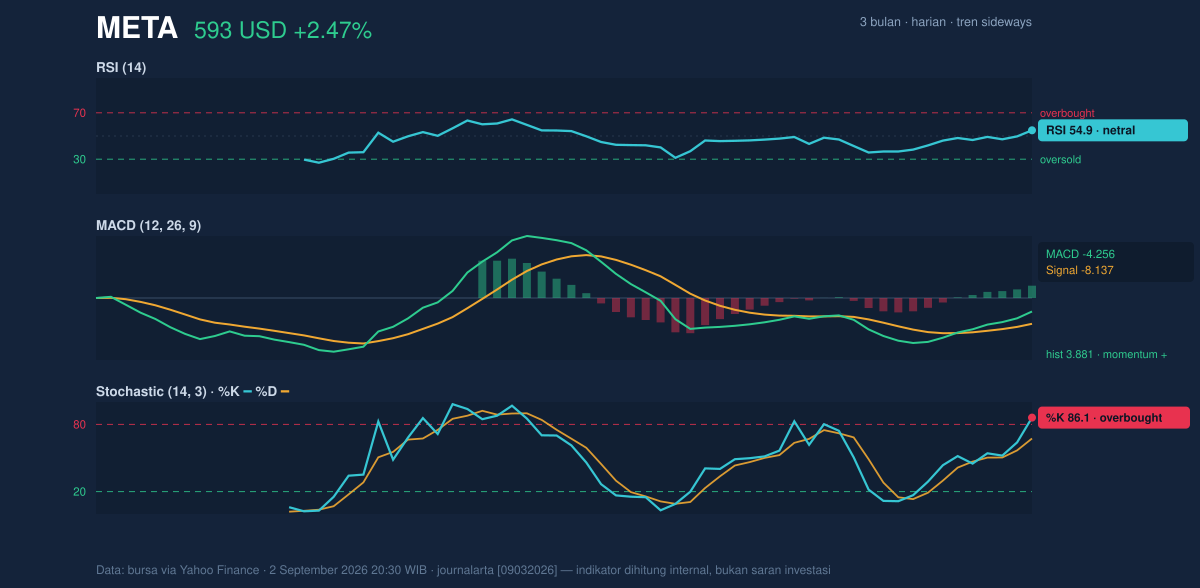
The momentum picture is more mixed than the price action. The RSI at 54.9 is neutral, which means the stock is neither overextended nor washed out. That is a useful signal because it leaves room for either continuation or cooling-off without forcing a dramatic reversal call.
The Stochastic %K at 86.1 and %D at 67.4 tell a different story. This oscillator is in overbought territory, which does not mean the stock must fall immediately; it means the recent advance has moved faster than its own short-term average and may need to pause or consolidate. When stochastic is elevated while RSI remains neutral, the market is often showing short-term enthusiasm without broad confirmation. That combination tends to produce choppy trading rather than clean upside.
The MACD is the most constructive element in the set. At -4.256, it is still below zero, but the signal line at -8.137 and the positive histogram of 3.881 show that downside momentum has improved materially. This is a classic “less bad” signal: the trend has not turned decisively bullish on a longer horizon, yet the rate of decline has eased enough to support the recent rebound. As shown in the chart, the MACD is telling a better story than the raw level alone would suggest.
Volatility & Volume
Volatility is present, but not extreme. The ATR(14) at 18.64, equal to 3.1% of price, indicates a market that can still move meaningfully in a session, though not in a panic-like fashion. That matters because a stock sitting near resistance with moderate ATR can either grind through the level or fail and retreat without much warning.
Volume adds credibility to the latest move. Last trade volume was 16,487,300, above the 20-hour average of 15,370,265, or about 1.1× normal. That is not a surge, but it is enough to show participation rather than a thin, easily reversed bounce. The OBV is rising, which is important because on-balance volume tracks whether money flow is accumulating with price. Rising OBV alongside a higher close suggests buyers have been supporting the move instead of merely chasing it late.
Key Levels & Scenarios
The immediate map is clear. The stock is trading at 89% of its 20-hour range, with support at 543.67 and resistance at 599.12. That placement near the top of the range is constructive, but it also leaves less room for easy upside before the market has to prove itself at resistance.
A clean push through 599.12 would put the stock above the recent ceiling and closer to the upper Bollinger band at 609.55. That would signal that the current rebound is being accepted by the market, not just tested. If it fails there, the more likely path is a return toward the SMA20 at 574.61, where the market has already shown willingness to balance.
The broader three-month frame still matters. The stock remains below the 3-month high of 686.08 and above the 3-month low of 524.49, which means it is trading in the middle-to-upper part of a wide historical band. That positioning usually reflects a stock that has recovered from stress but has not fully re-established dominance.
Technical Verdict: HOLD (wait & see)
HOLD (wait & see)
- Reason 1: Price is above SMA20 at 574.61 but still sitting just under SMA50 at 592.95, so trend confirmation is incomplete.
- Reason 2: MACD is positive in histogram form, but Stochastic is overbought, creating a push-pull between improving momentum and short-term fatigue.
- Reason 3: Volume is 1.1× normal and OBV is rising, which supports the move, yet resistance at 599.12 has not been cleared.
- Verdict invalidated if price falls below 543.67, the 20-hour support.
- Ideal Entry Range: 574.61 to 592.95
- Exit Target: 599.12 to 609.55
- Stop Loss protection: below 543.67
For non-traders, this means Meta looks healthier than it did a few sessions ago, but the chart is still asking for proof before it can be called decisively strong.
“The market is close to a decision point, and the next move will tell us whether this is a real recovery or just a pause in a wider range.”
Summary Data META
| Last price | 592.85 USD |
| Change 1 day / 5 days / 1 month | 2.47% / 2.90% / 0.69% |
| Trend / MA-cross | sideways / none |
| SMA20 / SMA50 | 574.61 / 592.95 |
| RSI (14) / Stochastic %K | 54.9 / 86.1 |
| Bollinger %B / ATR | 76% / 18.64 |
| Support / Resistance 20 days | 543.67 / 599.12 |
| Data as of | 2 September 2026 20:30 WIB |
Track META stock price daily: live levels, support/resistance and our full META analysis history.