NVDA Stock Gains 3.21% Today, Momentum Gains
On September 3, 2026: price 224.41 USD, trend uptrend, RSI 56.6, support 208.48, resistance 227.98. technical analysis of nvda stock. NVDA Stock Gains — full…
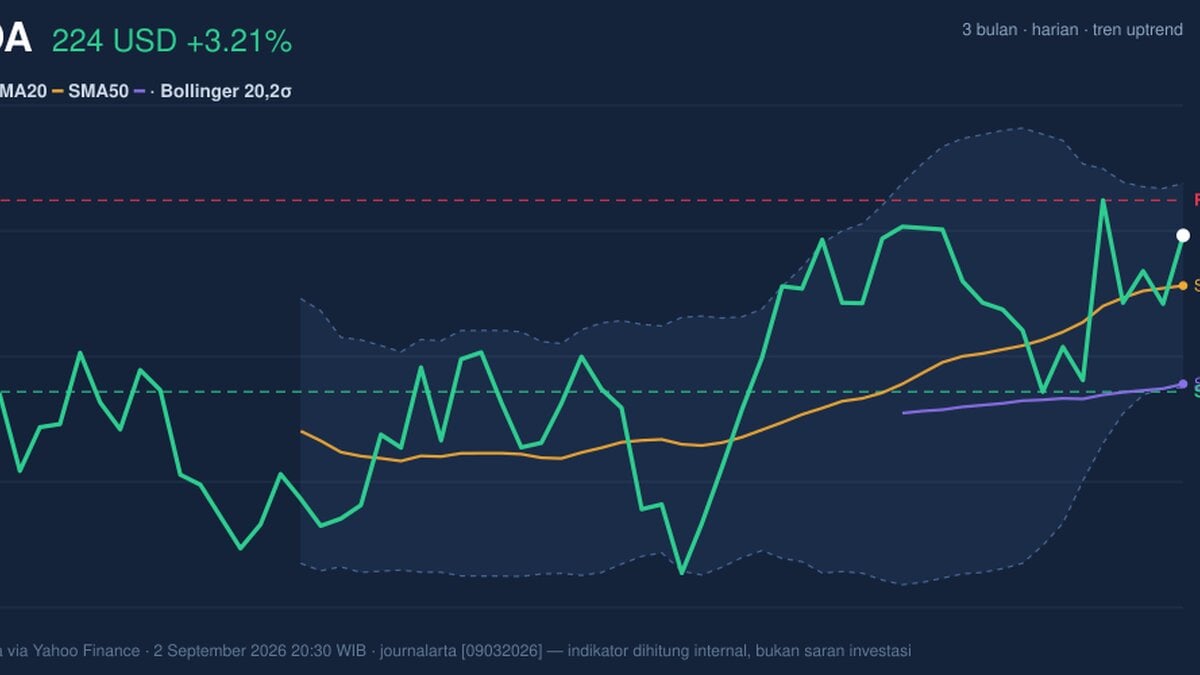
Nvidia rose on NASDAQ as NVDA climbed to 224.41 USD on 2 September 2026, a move that left the stock just below its recent ceiling and still above its short-term trend line. The move was not dramatic in chart terms. It was, however, meaningful: price is holding above the key moving averages while momentum remains positive, which tells traders the latest advance is being supported rather than simply bouncing on thin air.
Trend & Price Action
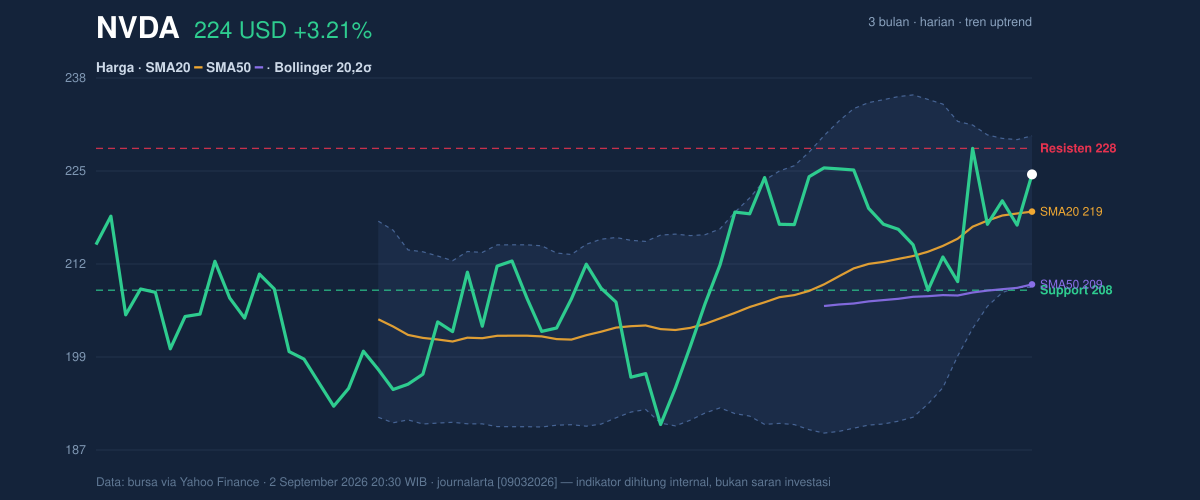
The share price is trading above both SMA20 at 219.29 and SMA50 at 209.28, a classic sign that the stock remains in an uptrend. In plain language, the average price over the past month is still below the current level, and the longer average is lower still, which means buyers have been willing to pay up across both short and medium horizons.
That matters because the slope of SMA20 is 1.73% over 5 days, showing the short-term trend is still rising rather than flattening out. There is no new MA-cross, so the chart is not flashing a fresh bullish crossover signal; instead, it is showing continuation. That often points to a trend that is already established and now being tested for durability.
The stock also sits at 82% of its 20-hour range, with 20-hour support at 208.48 and 20-hour resistance at 227.98. As shown in the chart, NVDA is closer to the top of that range than the bottom, which usually means the market is pricing in strength but has not yet cleared the next visible barrier. The 3-month high at 230.47 is only slightly above current levels, so the stock is trading near an area where prior advances have already met selling pressure.
Oscillators & Momentum
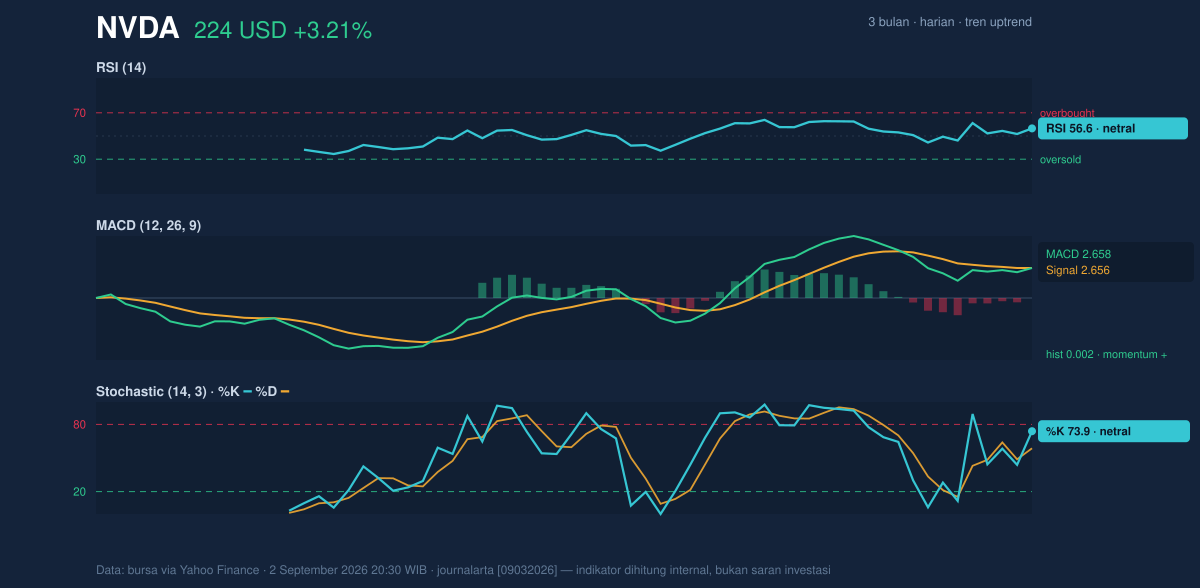
The momentum picture is constructive, but not overheated. RSI at 56.6 is neutral, which means the stock is neither stretched into obvious overbought territory nor washed out into oversold conditions. That is a useful signal: the rally has room to continue, but it is not being driven by the kind of extreme momentum that often attracts fast reversals.
The Stochastic reading of 73.9 / 58.7 is also neutral, though it leans closer to the upper half of the range. Stochastic compares recent closing prices with the recent trading range, so a reading near the top suggests the stock has been closing relatively strongly, but not with the kind of force that would confirm a breakout on its own.
The cleanest momentum cue comes from MACD at 2.658 versus a signal line at 2.656, with a histogram of 0.002. That tiny positive spread means bullish momentum is still present, but only just. In other words, the trend is intact, yet the engine is idling near the threshold where traders begin watching for either acceleration or fatigue. As shown in the momentum chart, this is a positive but delicate setup rather than a powerful thrust.
Volatility & Volume
The Bollinger Band structure adds an important nuance. With the upper band at 229.71, the middle band at 219.29, and the lower band at 208.86, price is sitting above the midpoint and approaching the upper band. The %B reading of 75% means NVDA is trading in the upper three-quarters of the band range, which usually reflects strength without yet confirming a breakout. The 9.5% band width is described as normal, so the chart is not in a volatility squeeze that would typically precede a sharp expansion. Instead, it suggests a market that is active but not unusually compressed.
ATR helps frame the likely scale of movement. ATR(14) at 7.17, or 3.2% of price, indicates moderate daily volatility. That is enough for meaningful swings, but not so high that the chart is signaling disorder. For readers, ATR is a measure of how much the stock tends to move in a day; here, it says the stock can travel, but within a fairly contained rhythm.
Volume complicates the picture slightly. Last volume was 156,676,500, about 1.2× normal versus the 20-hour average of 126,377,490. That means the latest move had participation, which is supportive. But OBV is down, and OBV tracks whether volume has been leaning more toward accumulation or distribution over time. A falling OBV while price is rising can mean the advance is not yet fully confirmed by longer-running money flow. That is not a bearish verdict by itself, but it is a warning that some underlying participation may be softer than the price action suggests.
Key Levels & Scenarios
The nearest technical ceiling is clear: 227.98 from 20-hour resistance, followed closely by the 3-month high at 230.47. If NVDA can push through that zone, the chart would be signaling that price is no longer merely testing resistance but attempting to enter a new range.
On the downside, the first important floor is 219.29, the SMA20 and Bollinger middle band. That level matters because it is both a trend marker and a mean-reversion line; losing it would suggest the stock is slipping back toward its average rather than extending higher. Below that, 208.86 on the lower Bollinger band and 208.48 in 20-hour support form the next cluster of defense. A break beneath that area would weaken the current uptrend structure and likely shift attention to whether the recent rally was just a short-lived extension.
Technical Verdict: HOLD (wait & see)
HOLD (wait & see)
- RSI 56.6 and Stochastic 73.9 / 58.7 show positive but not decisive momentum.
- MACD 2.658 vs 2.656 is bullish, but the histogram at 0.002 is too small to call it strong confirmation.
- Price above SMA20 219.29 and SMA50 209.28 supports the trend, while OBV down argues for caution on volume confirmation.
Verdict invalidated if price breaks below 208.48.
- Ideal entry range: 219.29 to 224.41
- Exit target: 227.98 to 230.47
- Stop loss protection: 208.48 to 208.86
For non-traders: the chart still leans upward, but it has not yet proven that the next push is strong enough to clear resistance cleanly.
NVDA’s 3-month high is 230.47.
Summary Data NVDA
| Last price | 224.41 USD |
| Change 1 day / 5 days / 1 month | 3.21% / 7.04% / 2.37% |
| Trend / MA-cross | uptrend / none |
| SMA20 / SMA50 | 219.29 / 209.28 |
| RSI (14) / Stochastic %K | 56.6 / 73.9 |
| Bollinger %B / ATR | 75% / 7.17 |
| Support / Resistance 20 days | 208.48 / 227.98 |
| Data as of | 2 September 2026 20:30 WIB |
Track NVDA stock price daily: live levels, support/resistance and our full NVDA analysis history.