OCBC Stock Gains 1.05% Today, Testing Key Resistance
On September 3, 2026: price 31.85 SGD, trend uptrend, RSI 62.6, support 28.63, resistance 31.79. technical analysis of ocbc stock. OCBC Stock Gains — full…
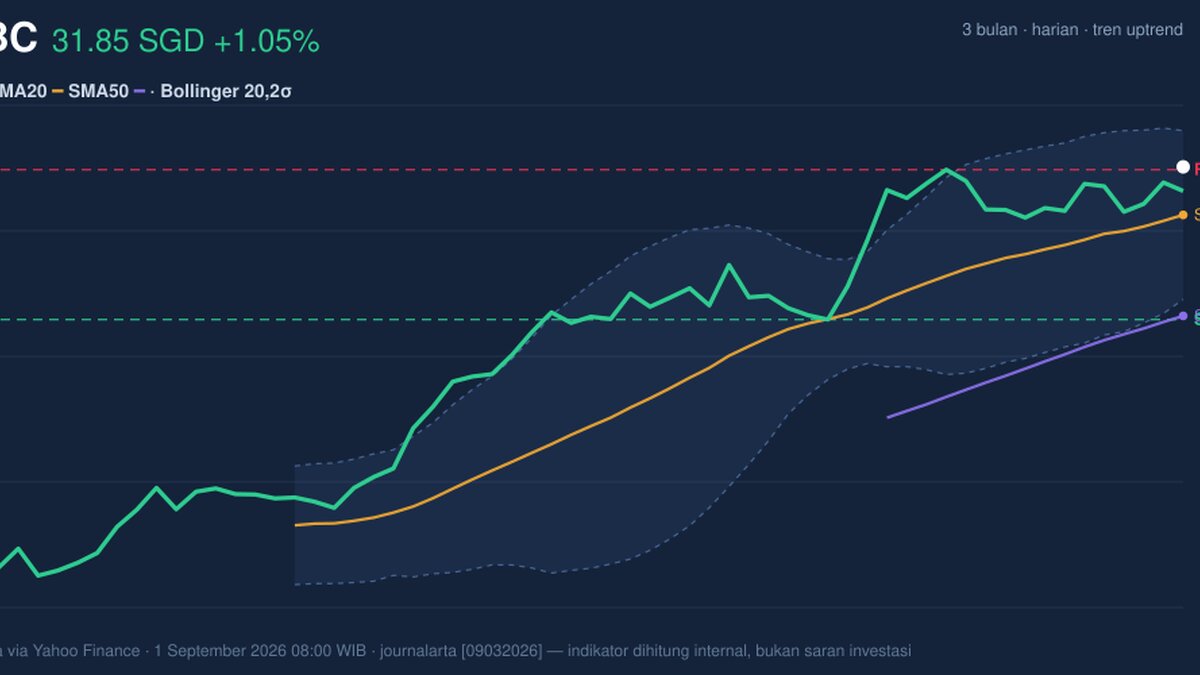
OCBC Bank’s shares on SGX edged to SGD 31.85, up 1.05% on the day, and the move matters less for the size of the gain than for where it happened: the stock is now trading just above its recent ceiling, with the chart showing a test of SGD 31.79 resistance and a fresh push to a 3-month high of SGD 31.86. That combination signals a market that is still willing to pay up for the stock, but not yet with the kind of volume or momentum that usually turns a breakout into a clean trend extension.
Trend & Price Action
The broader structure remains constructive. OCBC is in an uptrend, with the SMA20 at SGD 30.84 rising at 1.73% over 5 days, while the SMA50 at SGD 28.71 sits well below the current price. That gap tells investors the medium-term trend has already done the heavy lifting; the shares are no longer just recovering, they are trading in the upper part of their recent range.
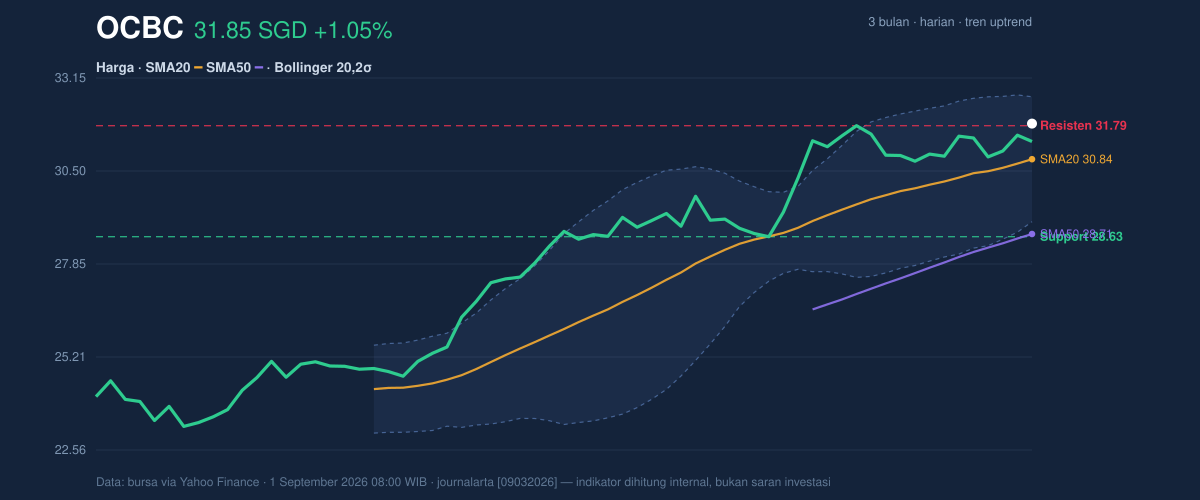
What makes the setup more interesting is that price is now sitting at 102% of the 20-hour range, which means it has moved beyond the upper boundary of the recent band rather than merely drifting within it. In plain terms, the market is pressing against resistance instead of consolidating beneath it. That is a sign of strength, but it also raises the risk of hesitation if follow-through buying does not appear.
The Bollinger upper band at SGD 32.61 is the next visible technical cap, with the middle band at SGD 30.84 acting as the trend line of least resistance. The 11.5% band width is normal, not compressed, so this is not a classic volatility squeeze waiting to explode. Instead, the chart suggests a steady climb that is already mature enough to be tested by profit-taking.
Oscillators & Momentum
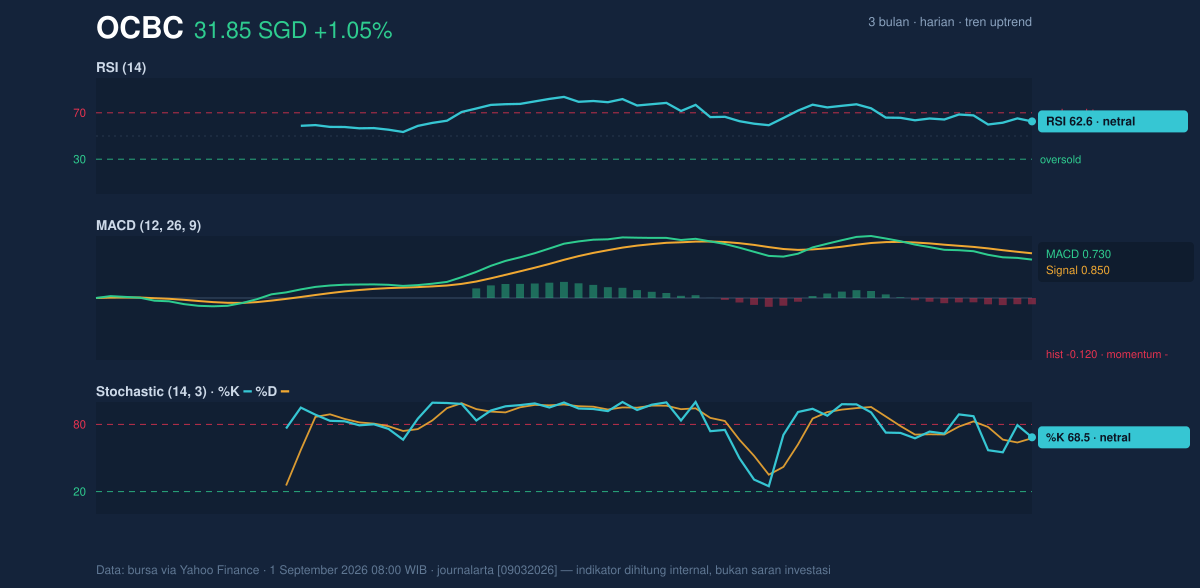
Momentum is less decisive than price. The RSI at 62.6 and Stochastic %K at 68.5 / %D at 67.7 are both in neutral territory, which means the stock is not yet technically overbought, but it is also not showing the kind of deep momentum thrust that typically accompanies a strong breakout. For general readers, RSI measures whether a move is stretched; here, it is elevated but not extreme.
The more important warning comes from MACD. OCBC’s MACD at 0.730 is still above zero, which keeps the trend positive, but it sits below the signal line at 0.850, and the histogram at -0.120 is negative. That combination means the trend is still up, but the pace of that uptrend has cooled. In other words, the stock is rising, yet the internal momentum is not fully confirming the latest price push.
That divergence is reinforced by the OBV decline and the fact that the latest volume of 4,946,537 is only 0.7x normal versus the 20-day average of 6,725,286. When price makes a new high on lighter participation, the move can still continue, but it is less convincing. It suggests that not enough fresh demand has arrived to validate the breakout attempt.
Volatility & Volume
The ATR(14) at 0.57, equal to 1.8% of price, points to moderate volatility. That matters because it sets expectations: OCBC is not behaving like a highly erratic name, so sharp intraday swings are less likely than a measured drift. But moderate volatility also means the stock can still retreat quickly if buyers step back at the top of the range.
The Bollinger position adds nuance. With %B at 79%, price is trading in the upper portion of the band structure, close enough to the upper band to show strength, but not so extended that the chart screams exhaustion. The message is balanced: the stock is strong, yet not euphoric. The lack of a volatility squeeze also means the market is not storing up energy for a dramatic move; the next leg will likely depend on whether buyers can keep absorbing supply near resistance.
Key Levels & Scenarios
The nearest technical floor is the SGD 31.79 resistance, now acting as a short-term pivot after the latest close. Above that, the chart points to the Bollinger upper band at SGD 32.61 as the next visible barrier. On the downside, the first meaningful cushion is the SMA20 at SGD 30.84, followed by SGD 29.06 at the lower Bollinger band. The broader support level from the chart sits at SGD 28.63, which also aligns with the market’s lower range structure.
If OCBC can hold above SGD 31.79 and keep volume from fading further, the chart would remain in breakout territory. If it slips back below the SMA20 at SGD 30.84, the move would look more like a failed probe of resistance than a fresh advance. And if price falls through SGD 29.06, the recent strength would lose its technical credibility.
Technical Verdict: HOLD (wait & see)
HOLD (wait & see)
- Price trend remains positive: OCBC is above the SMA20 and well above the SMA50, confirming the larger uptrend.
- Momentum is mixed: RSI 62.6 and Stochastic 68.5/67.7 are neutral, while MACD is below its signal line with a negative histogram.
- Participation is weak: volume is only 0.7x normal and OBV is falling, which weakens the breakout signal near resistance.
- Verdict invalidated if price falls below SGD 30.84, the SMA20 and first major trend support.
- Ideal entry range: SGD 30.84 to SGD 31.79
- Exit target: SGD 32.61
- Stop loss protection: below SGD 29.06
For non-traders, this means the share price still looks healthy, but the chart is asking for proof that the latest push above resistance is real.
Summary Data OCBC
| Last price | 31.85 SGD |
| Change 1 day / 5 days / 1 month | 1.05% / 1.14% / 10.32% |
| Trend / MA-cross | uptrend / none |
| SMA20 / SMA50 | 30.84 / 28.71 |
| RSI (14) / Stochastic %K | 62.6 / 68.5 |
| Bollinger %B / ATR | 79% / 0.57 |
| Support / Resistance 20 days | 28.63 / 31.79 |
| Data as of | 1 September 2026 08:00 WIB |
Track OCBC share price daily: live levels, support/resistance and our full OCBC analysis history.