ORCL Stock Gains 3.13%, Momentum Gains In Focus
On September 3, 2026: price 145.75 USD, trend sideways, RSI 49.8, support 141.32, resistance 156.22. technical analysis of orcl stock. ORCL Stock Gains — full…
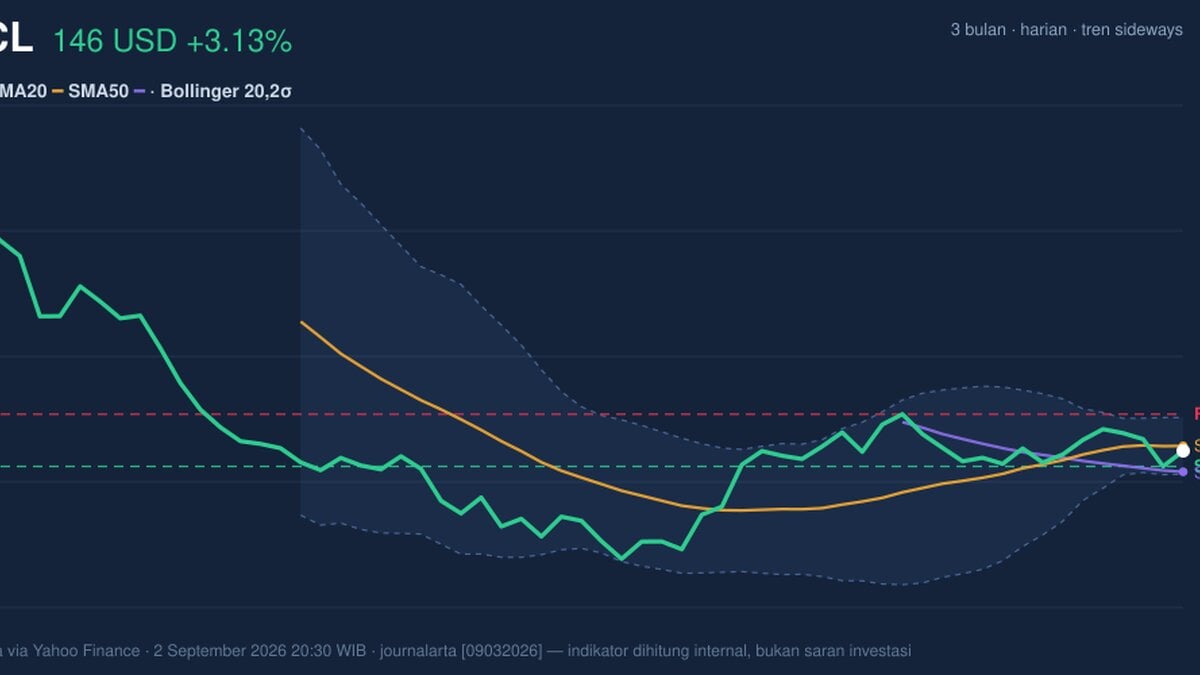
Oracle is trading in a delicate middle zone: the shares have bounced from the prior close, but the chart still shows a market that is not yet fully committing to a new trend.
Oracle Corp. (NYSE: ORCL) last traded at 145.75 USD, up 3.13% on the day after a 141.32 previous close, according to Yahoo Finance data cited in the market feed. That rebound matters because it brings the stock back into the lower half of its recent range, but it does not yet erase the message from the broader setup: Oracle remains in a sideways trend, with price still sitting below SMA20 at 147.19 even as it stays above SMA50 at 139.78. In plain terms, the stock is neither in clear recovery mode nor in breakdown mode; it is still negotiating whether the recent bounce has enough force to reclaim short-term trend control.
Trend & Price Action
The most important signal in the price structure is the split between the short and medium trend lines. The price below SMA20 tells traders that the latest bounce has not yet regained the average short-term cost basis of recent buyers. That often means overhead supply is still present: investors who bought near recent highs may use rallies to reduce exposure. At the same time, the fact that Oracle remains above SMA50 keeps the intermediate trend from turning negative. Put simply, the stock is not broken, but it is still proving itself.
The chart also shows no fresh MA-cross, which means there is no new moving-average signal to confirm a regime change. That matters because moving-average crossovers are often used as a shorthand for trend shifts; without one, the market is still in “wait and confirm” territory.
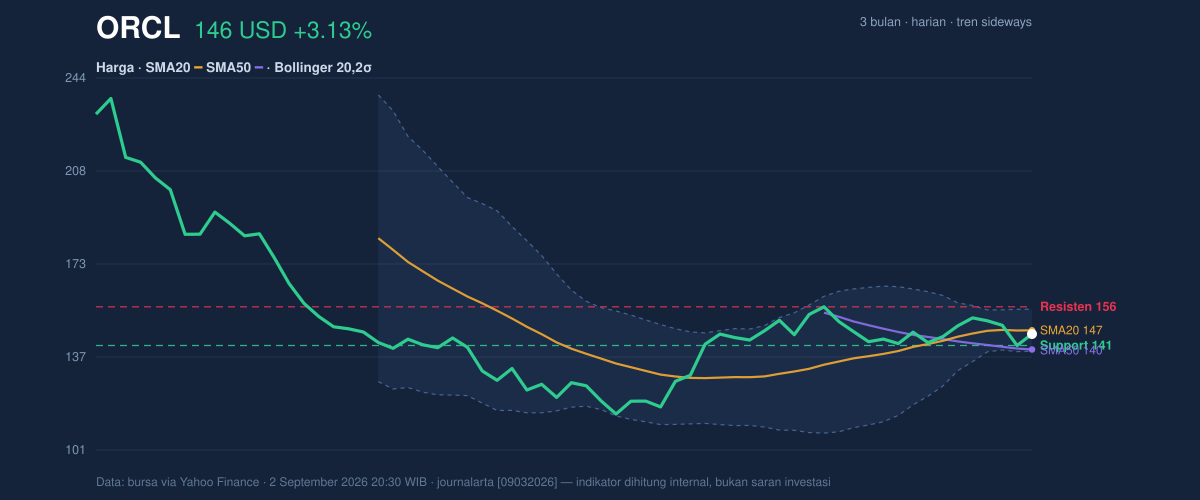
Price is also positioned at roughly 30% of its 20-hour range, between support at 141.32 and resistance at 156.22. That location is important: it suggests Oracle has recovered from the lower band of its recent trading band, but it is still far from testing the upper boundary where sellers have previously shown up. The 3-month range reinforces the scale of the move: the stock has traveled a long way from its 3-month high of 240.51 and sits well above the 3-month low of 114.50, a reminder that Oracle’s current price action is happening inside a much larger reset in valuation and sentiment.
A bounce is not the same as a breakout.
Oscillators & Momentum
Momentum indicators are giving a more balanced reading than the trend lines. The RSI at 49.8 is effectively neutral, which means the stock is neither stretched on the upside nor washed out on the downside. That is a useful signal in a sideways market: it says the latest move has not yet become overextended, but it also has not built enough pressure to force a trend decision.
The Stochastic %K at 43.9 and %D at 38.4 are also neutral, with a slight upward tilt. Stochastic measures where price sits within its recent range; readings in this zone suggest momentum is improving modestly, but not enough to call it a strong breakout setup. The MACD at 0.951 above its signal line at 0.902, with a positive histogram of 0.049, is the clearest bullish element in the technical mix. MACD is a trend-following momentum gauge, so a positive histogram means short-term momentum is running ahead of its signal line. However, because the margin is small, this is more a sign of stabilization than a powerful impulse.
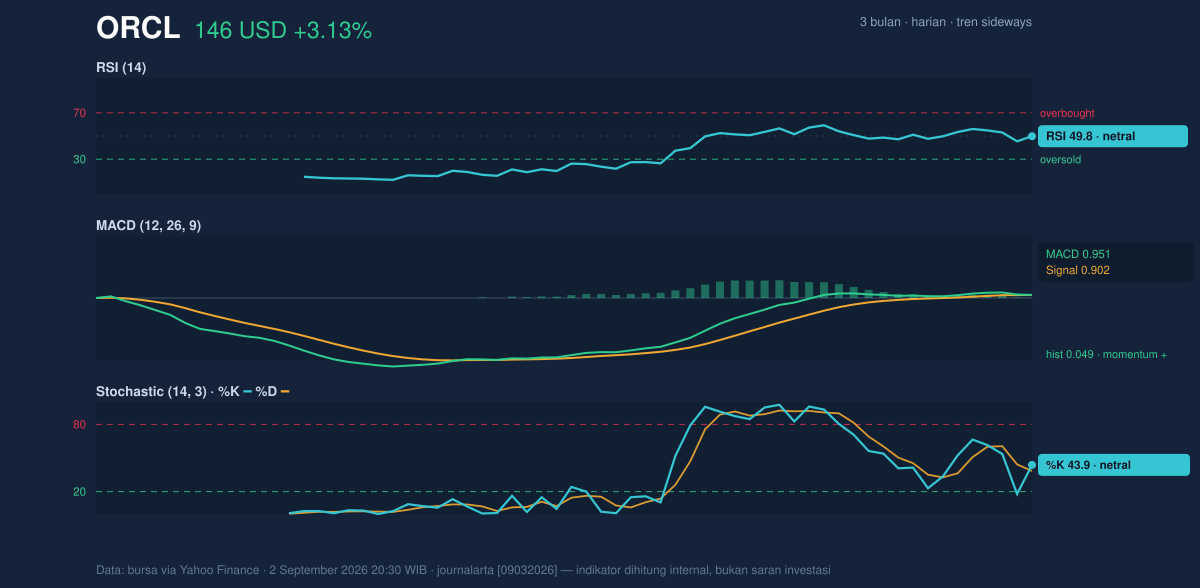
In other words, momentum has turned constructive, but it has not yet overwhelmed the broader sideways structure. That combination often leads to choppy trade rather than a straight-line move.
Volatility & Volume
Oracle’s ATR(14) of 5.93, equal to 4.1% of price, points to elevated day-to-day movement. ATR, or average true range, is a measure of how much a stock typically moves in a session; a reading like this means price swings can be wide enough to quickly test both support and resistance. For readers, that translates into a market where direction may still be undecided, but the path there can be fast.
The Bollinger Band setup adds an important layer. Price is trading below the middle band at 147.19, with upper band at 155.28 and lower band at 139.11. The %B at 41% shows Oracle is below the midpoint of the band structure, closer to the lower half than the upper half. That is not an oversold reading, but it does indicate the stock has not yet reasserted control above the mean. The 11.0% band width is described as normal, so this is not a volatility squeeze that typically precedes a sharp expansion; instead, it looks like a standard trading environment with room for either side to take charge.
Volume is close to normal at 21,868,100 versus a 20-hour average of 22,438,370, or about 1.0× typical activity. That means the rebound has not yet been backed by a clear surge in participation. Still, the OBV is rising, which is a supportive sign: on-balance volume tracks whether volume tends to accumulate on up days versus down days. A rising OBV suggests buyers are gradually gaining influence even if headline volume has not spiked.
Participation is improving, but conviction is not loud yet.
Key Levels & Scenarios
The market is watching a narrow corridor. The first line of defense is 141.32 support; if that level holds, the recent bounce can continue to build a base. Below that, the Bollinger lower band at 139.11 and the SMA50 at 139.78 cluster into a meaningful zone of technical support. That cluster matters because it is where trend followers and mean-reversion traders may both step in. On the upside, 147.19 is the immediate reclaim level, while 155.28 and then 156.22 resistance define the next ceiling. A move through that area would tell the market the rebound is no longer just a bounce inside a range.
If price fails to hold 141.32, the chart would shift toward a weaker structure, with the lower band and the 50-day average becoming the next tests. If price clears and holds above 147.19, the case for a recovery toward the upper band and resistance zone strengthens.
Technical Verdict: HOLD (wait & see)
HOLD (wait & see)
- Price is still below SMA20 at 147.19, so the short-term trend has not been fully reclaimed.
- MACD is positive and OBV is rising, which supports the bounce, but the signal is still modest rather than decisive.
- RSI at 49.8 and Stochastic at 43.9/38.4 are neutral, showing neither strong upside momentum nor a clear reversal failure.
Verdict invalidated if price falls below 141.32, because that would put the recent support break back on the table and weaken the current base.
- Ideal Entry Range: 141.32–147.19
- Exit Target: 155.28–156.22
- Stop Loss protection: below 139.11
For non-traders, this means Oracle is showing signs of recovery, but the chart still wants more proof before the move can be trusted.
“The market is asking Oracle to prove this bounce is real.”
Summary Data ORCL
| Last price | 145.75 USD |
| Change 1 day / 5 days / 1 month | 3.13% / -2.10% / 0.94% |
| Trend / MA-cross | sideways / none |
| SMA20 / SMA50 | 147.19 / 139.78 |
| RSI (14) / Stochastic %K | 49.8 / 43.9 |
| Bollinger %B / ATR | 41% / 5.93 |
| Support / Resistance 20 days | 141.32 / 156.22 |
| Data as of | 2 September 2026 20:30 WIB |
Track ORCL stock price daily: live levels, support/resistance and our full ORCL analysis history.