Shell Stock Analysis: Gains 2.95%, Testing Key Resistance
On September 3, 2026: price 3,443.00 GBp, trend sideways, RSI 60.5, support 3,277.50, resistance 3,440.00. technical analysis of shell stock.
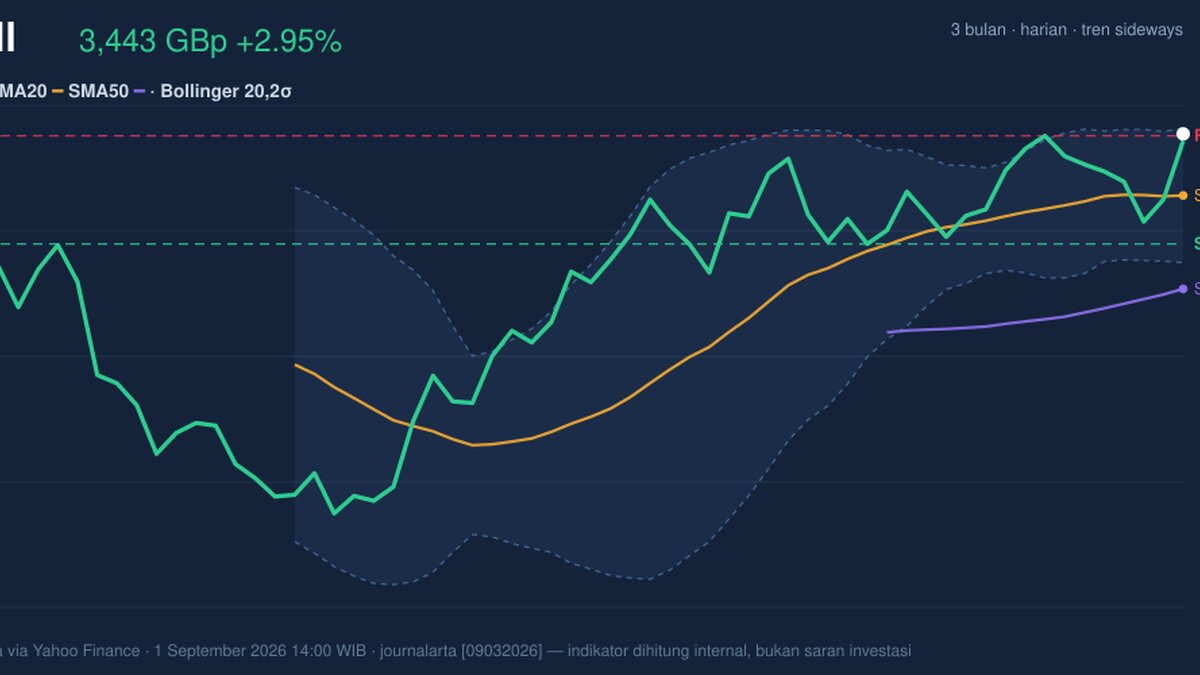
Shell plc edged higher on the London Stock Exchange on 1 September 2026, with Shell’s last price at 3,443.00 GBp after a 2.95% daily rise, but the move came right into a crowded technical zone where momentum signals are no longer fully in sync with price. The stock is still trading above its short- and medium-term averages, yet the chart now shows a market that is pressing against resistance while oscillators warn that the latest lift may be running ahead of itself.
Trend & Price Action
The first message from the chart is that Shell remains in a sideways trend, not a clean breakout trend, even though the price sits above both key moving averages. Price is above SMA20 at 3,350.45 and above SMA50 at 3,210.05, which tells traders the medium-term structure is still constructive and buyers have defended the recent pullback zone. But the absence of a new MA cross matters: it means the market is not receiving a fresh trend-confirmation signal from the averages, only continuation of an existing setup.
The slope of SMA20 at 0.27% over 5 days is gentle rather than forceful. That usually describes a market drifting upward inside a range, not one with strong directional conviction. The broader price position also matters: the stock is sitting close to the top of its recent band, with support at 3,277.50 and resistance at 3,440.00. As shown in the chart, price is effectively testing the upper edge of that range at 102% of the range, which is a classic sign that upside is being stretched relative to the recent balance area.
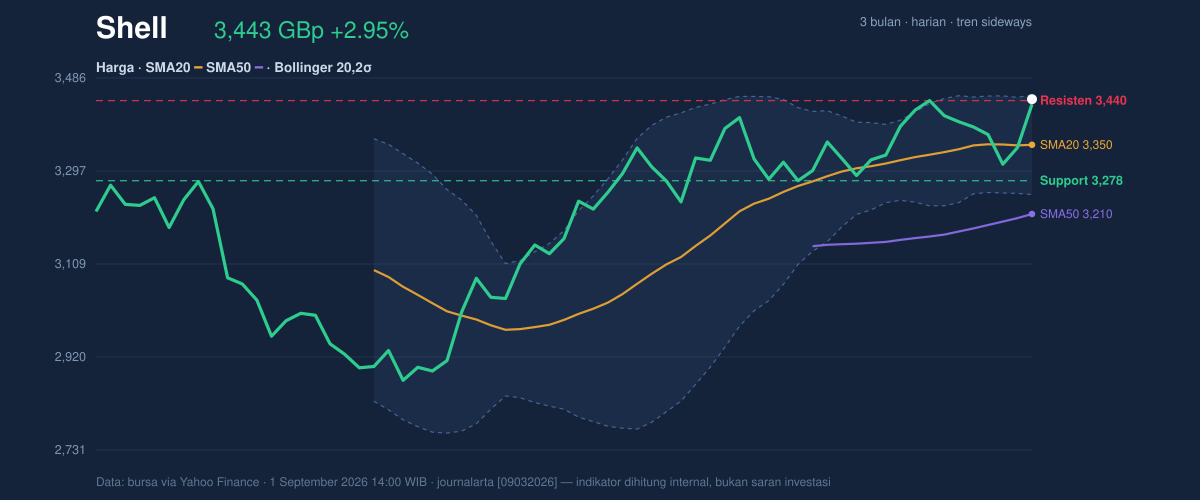
The 3-month frame reinforces that reading. Shell is well above the 3,3xx area that has acted as a short-term floor, but still below the 3,758.50 3-month high. That leaves room for continuation, yet also leaves the stock vulnerable to pauses if buyers fail to extend the move beyond the current ceiling.
Oscillators & Momentum
The momentum panel is more cautious than the price chart. RSI at 60.5 is still neutral, which means the stock is not in a classic overbought condition on that measure alone. But the Stochastic %K at 87.1 against %D at 53.2 is a stronger warning flag: stochastic is in overbought territory, and the gap between the two lines suggests the move has become extended in the short term. In plain language, price has climbed faster than the oscillator would like to see for a sustainable advance.
That warning is reinforced by MACD. MACD at 39.437 is below the signal line at 45.830, with a histogram of -6.392. The histogram turning negative means the recent push higher is losing internal strength, even if the share price itself is still rising. This is the key divergence in the setup: price is near resistance, while momentum confirmation is fading.
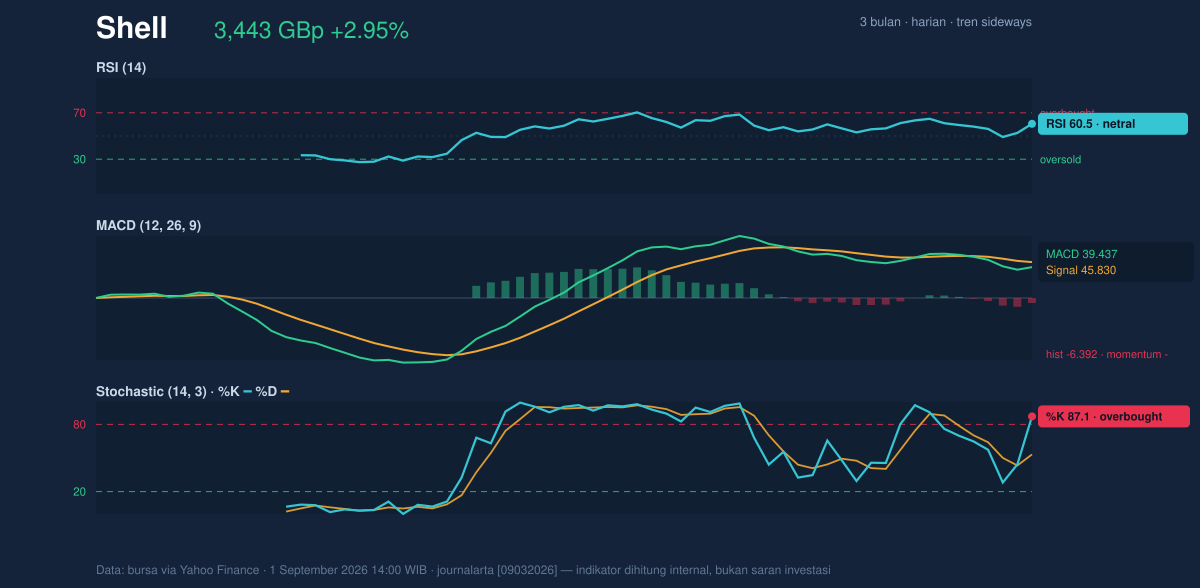
Taken together, the oscillators do not argue for a collapse, but they do argue for caution. The chart is showing a market that has advanced into resistance with short-term momentum stretched and medium-term momentum weakening.
Volatility & Volume
Volatility is not spiking, but it is not asleep either. ATR(14) at 54.04, or 1.6% of price, points to moderate daily movement. That matters because a moderate ATR combined with a 6.0% Bollinger band width can produce abrupt swings if price escapes the band. The bands are narrowing, which is the technical equivalent of compression: energy is building, and the next move could be sharper than the recent day-to-day drift. %B at 96% shows the price is trading very close to the upper Bollinger band at 3,451.62, leaving little room before the stock bumps into the outer envelope.
Volume adds an important twist. 17,710,332 shares changed hands, about 1.9 times the 20-hour average of 9,550,476. That is real participation, not a thin move. But OBV is falling, and that is the part that tempers the enthusiasm. On-balance volume falling while price rises often signals that the latest advance is not being backed by broad accumulation. In other words, the market is trading actively, but the volume trend is not fully endorsing the price trend.
Key Levels & Scenarios
The immediate technical map is straightforward. Resistance sits at 3,440.00, almost exactly where price is trading, while the Bollinger upper band at 3,451.62 is the next nearby ceiling. Above that, the chart would need to prove that the squeeze is resolving upward rather than simply rejecting price.
On the downside, support at 3,277.50 is the first line of defense, with SMA20 at 3,350.45 acting as an important pivot inside the range. If price loses the moving-average area, the market would likely be telling traders that the recent lift was only a range-bound rebound, not the start of a stronger leg higher. The 3-month low at 2,559.50 remains far away, so the immediate story is not one of structural damage, but of whether the current test of resistance can be sustained.
Technical Verdict: HOLD (wait & see)
HOLD (wait & see)
- Why: price is above SMA20 and SMA50, which keeps the broader structure positive.
- Why: MACD is below the signal line and the histogram is negative, showing momentum is weakening even as price rises.
- Why: Stochastic is overbought and %B is at 96%, so the stock is pressing the upper edge of its Bollinger band.
- Verdict invalidated if price breaks below 3,277.50, because that would mean the recent range support has failed.
- Ideal entry range: 3,350.45 to 3,277.50
- Exit target: 3,451.62, then 3,440.00 as the nearby resistance checkpoint
- Stop loss protection: below 3,277.50
For non-traders, this means Shell is still technically firm, but the chart is asking for proof before the latest rise can be trusted. “It feels like the market is leaning on the door, not yet walking through it.”
Summary Data Shell
| Last price | 3,443.00 GBp |
| Change 1 day / 5 days / 1 month | 2.95% / 1.35% / 1.10% |
| Trend / MA-cross | sideways / none |
| SMA20 / SMA50 | 3,350.45 / 3,210.05 |
| RSI (14) / Stochastic %K | 60.5 / 87.1 |
| Bollinger %B / ATR | 96% / 54.04 |
| Support / Resistance 20 days | 3,277.50 / 3,440.00 |
| Data as of | 1 September 2026 14:00 WIB |
Track Shell share price daily: live levels, support/resistance and our full Shell analysis history.