Singtel Stock Analysis: Drops 1.76%, Death Cross Pressure
On September 3, 2026: price 4.46 SGD, trend sideways, RSI 51.8, support 4.25, resistance 4.54. technical analysis of singtel stock. Singtel Stock Analysis —…
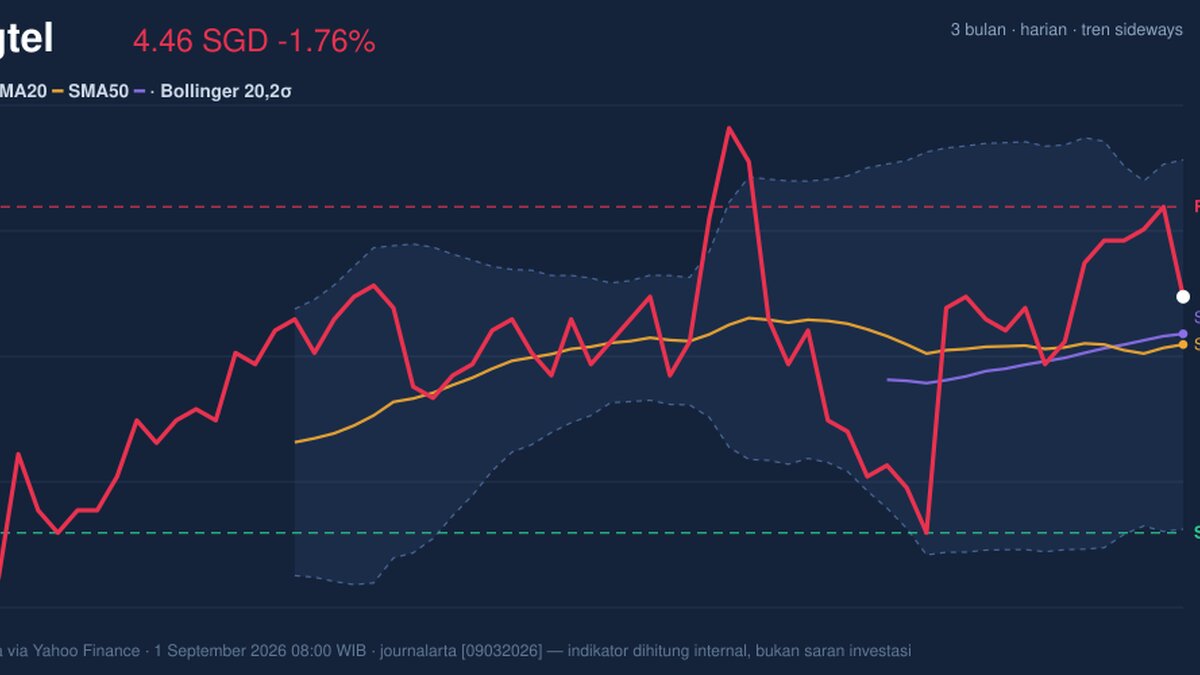
Singapore Telecom (Singtel) fell to 4.46 SGD on SGX in early September trade, down from 4.54 the previous close, as the counter moved back below a near-term ceiling at 4.54 even while holding above its short moving averages. The price action looks less like a decisive trend break than a market testing whether recent softness is merely a pause inside a broader sideways range, with the chart showing a stock that is still digesting the recent death cross between the 20-day and 50-day averages.
Trend & Price Action
The shares are still trading in a sideways structure, and that matters because sideways markets often punish both early optimism and late pessimism. The slope of the SMA20 at -0.02% over 5 days says short-term momentum is slightly negative, but not aggressively so, which helps explain why the stock has not unraveled despite the day’s decline.
The important detail is that price remains above the SMA20 at 4.42 and also above the SMA50 at 4.43, even though the moving-average relationship has already produced a death cross. That combination is a mixed signal: the crossover warns that recent momentum has weakened enough to challenge the trend, while the fact that price is still above both averages suggests sellers have not yet forced a full breakdown. In plain terms, the chart is showing hesitation rather than capitulation.
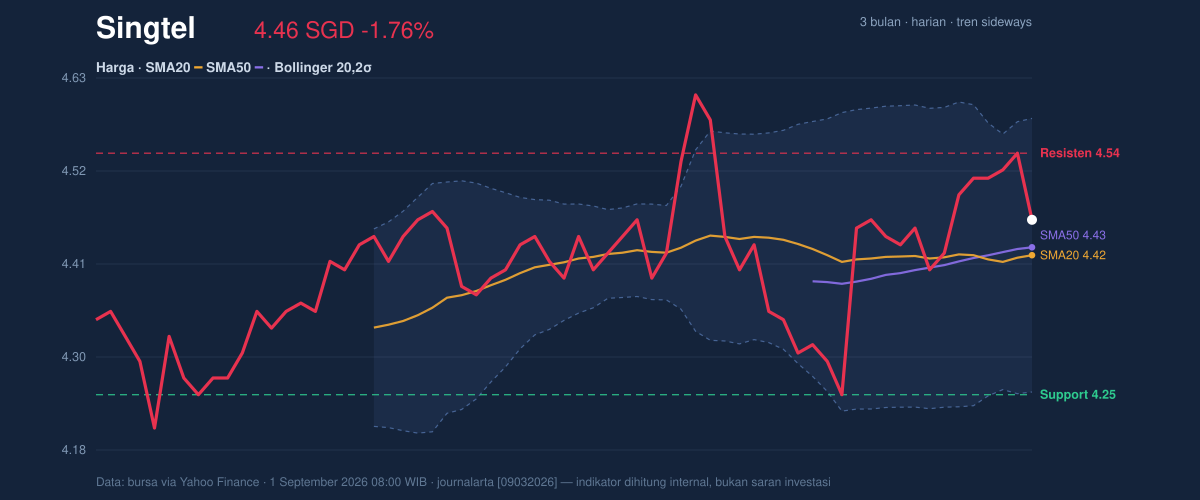
The stock is also sitting in the upper half of its 20-hour range, with support at 4.25 and resistance at 4.54, and it remains below the 3-month high of 4.70 but above the 3-month low of 4.15. That positioning tells readers the market has not chosen a new direction; it is still trading inside a wider band that has room on both sides.
Oscillators & Momentum
Momentum indicators are not giving a strong warning, but they are also not confirming a clean upside push. The RSI at 51.8 is neutral, which means the stock is neither overbought nor oversold and can move either way without first needing to “cool off” or “rebound” from an extreme. The Stochastic %K at 67.5 and %D at 85.5 are also neutral, though the gap between the two lines suggests short-term momentum has eased from stronger levels.
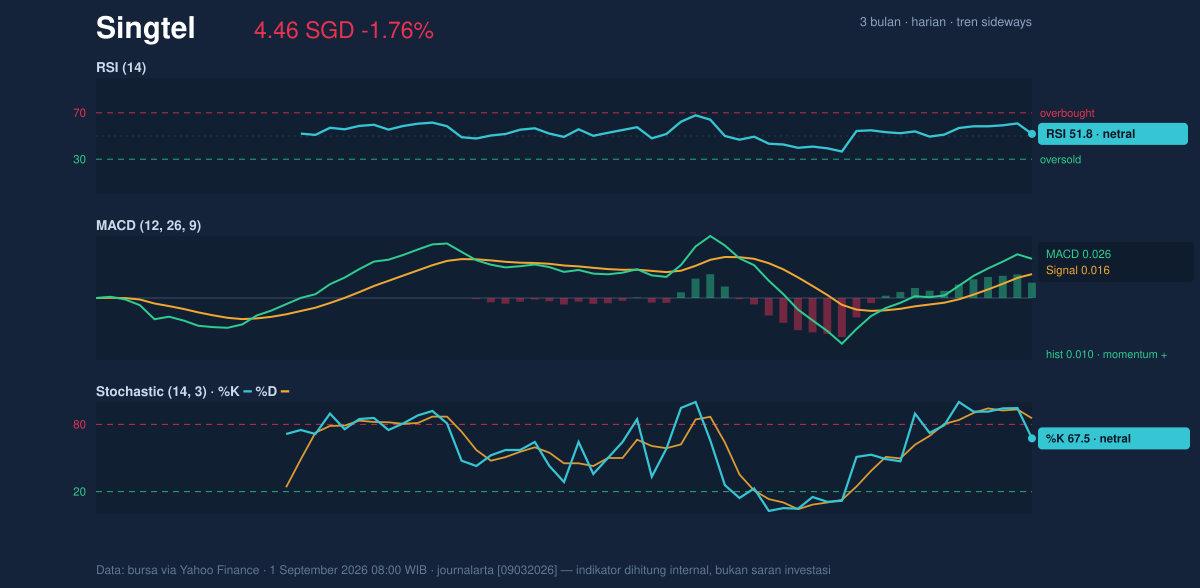
The more constructive part of the momentum picture comes from MACD. With MACD at 0.026 above its signal line at 0.016, the histogram at 0.010 remains positive, which means underlying momentum is still mildly supportive even after the pullback. That is important because MACD often acts as a slower confirmation tool: it is telling us the recent dip has not yet fully reversed the broader short-term thrust. In other words, the stock is soft, but not technically broken.
Volatility & Volume
Bollinger Bands add a useful layer to the story. Price at 4.46 sits between the middle band at 4.42 and the upper band at 4.58, with %B at 63%, which means the share price is trading above the midline but still below the upper boundary. That usually signals a market with mild upward bias inside a contained range, not a runaway move.
More importantly, the band width is only 7.4% and is narrowing, a squeeze that often precedes a larger move once the range gives way. Squeezes do not predict direction by themselves, but they do warn that quiet trading can turn into a sharper break or breakout. With ATR(14) at 0.08, or 1.9% of price, daily movement is still moderate, so any move out of the current band may develop gradually rather than explosively.
Volume does not suggest panic or exhaustion. Last volume was 27,700,300, just above the 20-hour average of 27,012,439, or about 1.0× normal. That is enough to confirm participation, but not enough to say institutions are forcing a new trend. The rising OBV is the more encouraging clue, because on-balance volume tracks whether volume is accumulating behind price rather than merely churning. Together, the volume data says the market is engaged, but not yet committed to a decisive move.
Key Levels & Scenarios
The immediate reference points are clear. 4.54 is the first resistance to reclaim, while 4.25 is the key support that needs to hold if the current range is to stay intact. Between those levels, the stock is basically trapped in a corridor where signals can flip quickly.
If price moves above 4.54, the chart would start to lean toward a test of the 4.58 Bollinger upper band and potentially the 4.70 3-month high. If instead it falls below 4.25, the market would be signaling that the squeeze is resolving to the downside, opening the way toward the 4.15 3-month low. For now, the technical picture is still balanced, but it is a balance with pressure building beneath it.
Technical Verdict: HOLD (wait & see)
HOLD (wait & see)
- Price is above SMA20 at 4.42 and SMA50 at 4.43, which prevents a full bearish breakdown.
- MACD is positive at 0.026 versus 0.016, showing momentum has not turned decisively negative.
- Bollinger Bands are squeezing, with width at 7.4%, so the stock may be preparing for a larger move rather than offering a clean trend signal now.
- Verdict invalidated if price breaks below 4.25, because that would weaken the current range structure and expose the lower end of the 3-month band.
- Ideal entry range: 4.42 to 4.46
- Exit target: 4.54 to 4.58
- Stop loss protection: below 4.25
In plain English, Singtel is not giving a clear directional signal yet, so the chart says wait for the range to resolve before treating the move as meaningful.
The next technical test is whether 4.54 gives way or 4.25 cracks.
Summary Data Singtel
| Last price | 4.46 SGD |
| Change 1 day / 5 days / 1 month | -1.76% / -0.67% / 1.36% |
| Trend / MA-cross | sideways / death |
| SMA20 / SMA50 | 4.42 / 4.43 |
| RSI (14) / Stochastic %K | 51.8 / 67.5 |
| Bollinger %B / ATR | 63% / 0.08 |
| Support / Resistance 20 days | 4.25 / 4.54 |
| Data as of | 1 September 2026 08:00 WIB |
Track Singtel share price daily: live levels, support/resistance and our full Singtel analysis history.