Testing Support Level, Tencent Stock Drops 3.27% Today
On September 3, 2026: price 438.20 HKD, trend sideways, RSI 43.1, support 440.00, resistance 492.20. technical analysis of tencent stock.
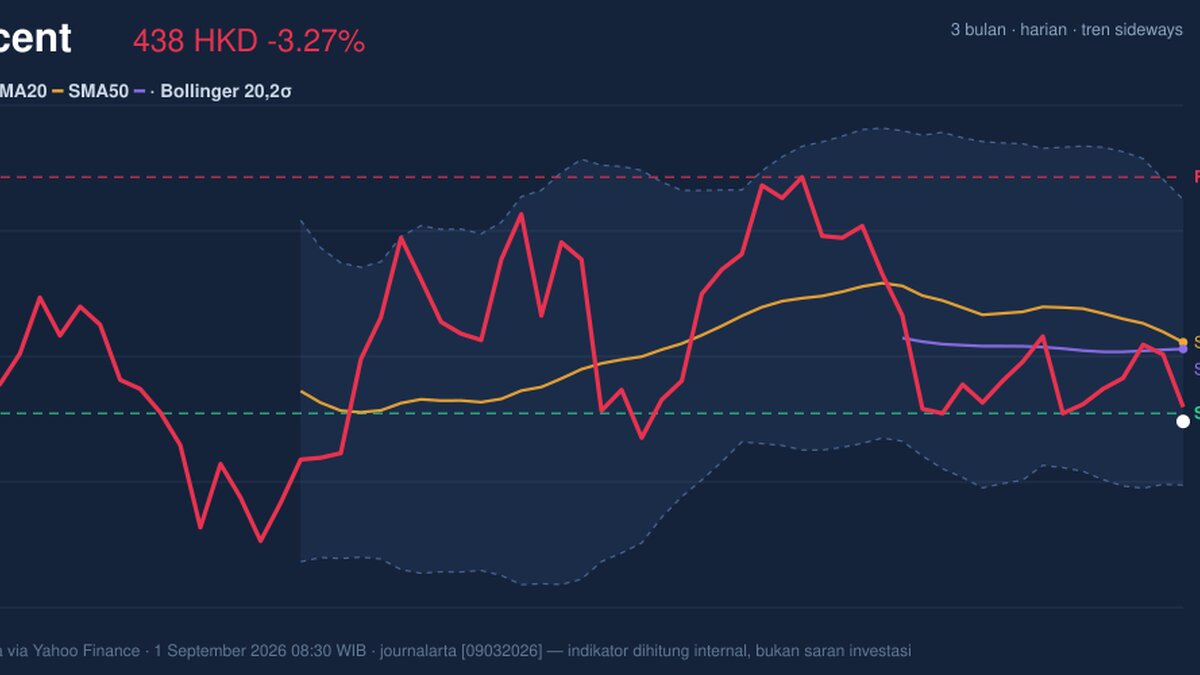
Tencent Holdings fell on the Hong Kong exchange on 1 September 2026, with 0700.HK last trading at HKD 438.20, down from the previous close of 453.00, as the stock extended a month-long slide and remained below its short-term moving averages, according to data from Yahoo Finance.
The move matters because it is not just a one-day dip. Tencent is now trading below the SMA20 at 455.71 and the SMA50 at 454.23, which means the stock sits under the average price investors have paid over the past month and roughly two months. In plain terms, that usually signals sellers still have the upper hand, even if the broader pattern is only sideways rather than in a clean downtrend. The SMA20 slope at -1.60% over 5 days shows the recent trend is leaning lower, but the lack of a fresh moving-average crossover suggests the chart has not yet entered a more decisive bearish phase.
Trend & Price Action
As shown in the chart, Tencent is now positioned closer to the lower half of its recent range, with the share price about 3% below the 20-hour support zone at 440.00 and well under the 20-hour resistance at 492.20. That placement is important because it tells traders the stock has lost momentum inside a range that has been active for months. The 3-month high of 497.80 remains far overhead, while the 3-month low at 411.00 is not far enough away to rule out a deeper test if current weakness persists.
The Bollinger Bands help frame that weakness. The last price sits below the middle band at 455.71 and near the lower band at 424.17, with %B at 22%. That reading means Tencent is trading in the lower portion of its recent volatility envelope, but not yet at a classic oversold extreme. The band width of 13.8% is described as normal, so this is not a squeeze that often precedes a sharp breakout; instead, it suggests the market is moving in a fairly controlled way, with room for either continued drift lower or a stabilization attempt.
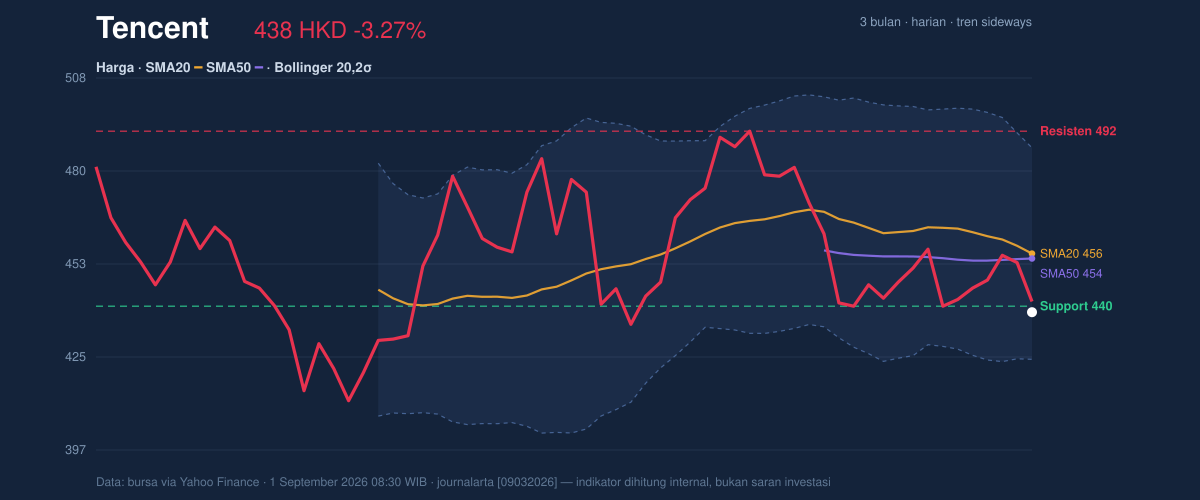
In other words, the chart is weak, but not broken.
Oscillators & Momentum
The momentum picture is mixed, and that is what makes the stock interesting rather than purely bearish. The RSI at 43.1 is neutral, which means Tencent is not in the kind of oversold condition that often triggers aggressive rebound buying. At the same time, the Stochastic %K at 20.6 and %D at 38.4 show the stock is close to the lower end of its recent range, but still without a confirmed reversal signal. In practical terms, the oscillator is warning that downside pressure has been building, yet it is not shouting that the move is exhausted.
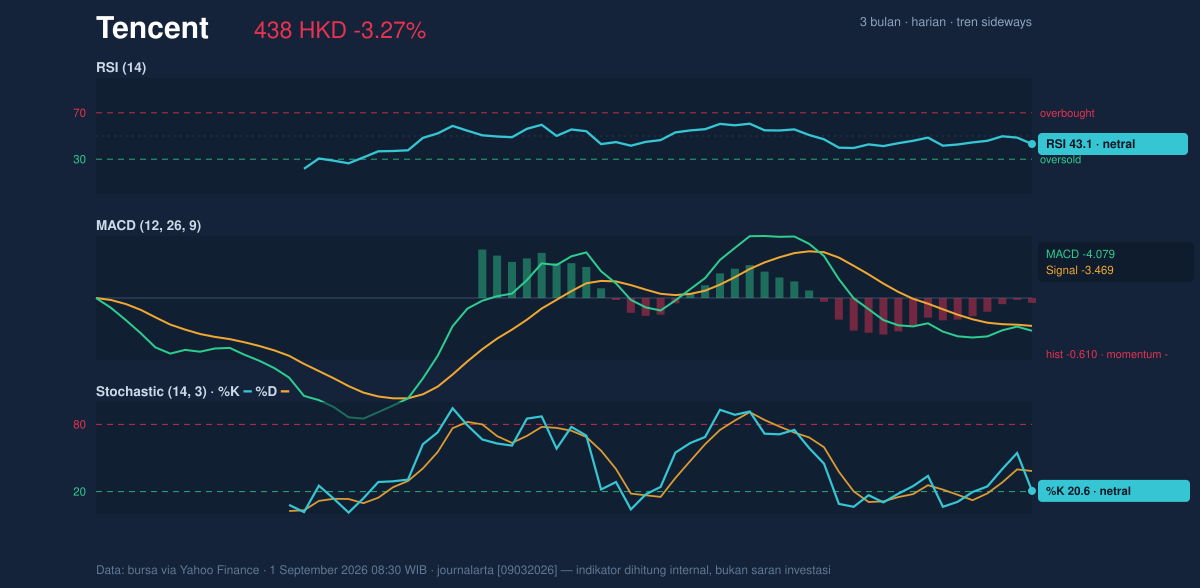
The clearest negative signal comes from MACD. With MACD at -4.079, below the signal line at -3.469, and a histogram of -0.610, the short-term momentum remains negative. That matters because MACD is not just below zero; it is also below its trigger line, which means bearish momentum is still active rather than fading. For readers less familiar with the term, a negative histogram means the gap between the MACD line and the signal line is widening in the wrong direction for bulls.
Volatility & Volume
Tencent’s ATR(14) of 11.77, equal to 2.7% of price, points to moderate volatility. That suggests daily swings are meaningful but not chaotic. For market participants, this matters because moderate ATR gives the stock enough movement to test support or resistance without requiring a major news shock. The current setup therefore looks like a technical digestion phase rather than a panic move.
Volume adds an important nuance. Last volume was 20,289,781, below the average 20-hour volume of 23,238,873, or 0.9x normal. That means the latest drop did not come with a surge of forced selling. Weak volume on a decline can imply the market is drifting lower more than capitulating. Yet the OBV is rising, which is a subtle but meaningful contrast: on-balance volume tracks whether volume is accumulating on up days or down days, so a rising OBV can hint that larger money is not fully abandoning the name even while the price remains soft.
That divergence is worth watching.
Key Levels & Scenarios
The immediate technical map is straightforward. Support at 440.00 is the first line to watch, and the lower Bollinger band at 424.17 provides a second layer of support if that level gives way. On the upside, 455.71 is the first reclaim point because it is both the SMA20 and the Bollinger midline, while 492.20 is the stronger resistance zone that would need to be cleared to restore a more constructive range structure.
If Tencent can recover and hold above 455.71, the chart would begin to repair the damage from the recent decline. If it fails to hold 440.00, the market may start testing the lower band and then the 411.00 3-month low area. The current price is not far enough above that floor to ignore it.
The key signal is that Tencent is weak on trend, negative on MACD, but not yet in a full breakdown state.
Technical Verdict: HOLD (wait & see)
- Reason 1: Price is below SMA20 at 455.71 and SMA50 at 454.23, confirming the stock has not regained short-term trend control.
- Reason 2: MACD is negative with the histogram below zero, so momentum still points downward.
- Reason 3: RSI at 43.1 and Stochastic at 20.6/38.4 are not strong enough to confirm a rebound, even though they are nearing lower-range territory.
- Verdict invalidated if price breaks above 455.71 and holds there, because that would challenge the current bearish bias and improve the trend structure.
- Ideal Entry Range: 424.17 to 440.00
- Exit Target: 455.71, then 492.20
- Stop Loss protection: below 411.00
For non-traders, this means the stock is still under pressure, but the chart has not yet reached the kind of breakdown that would force a more aggressive bearish reading.
“We’re not seeing panic, but we are seeing a market that still hasn’t found the conviction to turn higher.”
Summary Data Tencent
| Last price | 438.20 HKD |
| Change 1 day / 5 days / 1 month | -3.27% / -0.86% / -10.13% |
| Trend / MA-cross | sideways / none |
| SMA20 / SMA50 | 455.71 / 454.23 |
| RSI (14) / Stochastic %K | 43.1 / 20.6 |
| Bollinger %B / ATR | 22% / 11.77 |
| Support / Resistance 20 days | 440.00 / 492.20 |
| Data as of | 1 September 2026 08:30 WIB |
Track Tencent share price daily: live levels, support/resistance and our full Tencent analysis history.