Visa Testing Key Resistance: Stock Gains 1.54% (September 3, 2026)
On September 3, 2026: price 378.40 USD, trend uptrend, RSI 60.4, support 358.84, resistance 384.14. technical analysis of visa stock. Visa Testing Key…
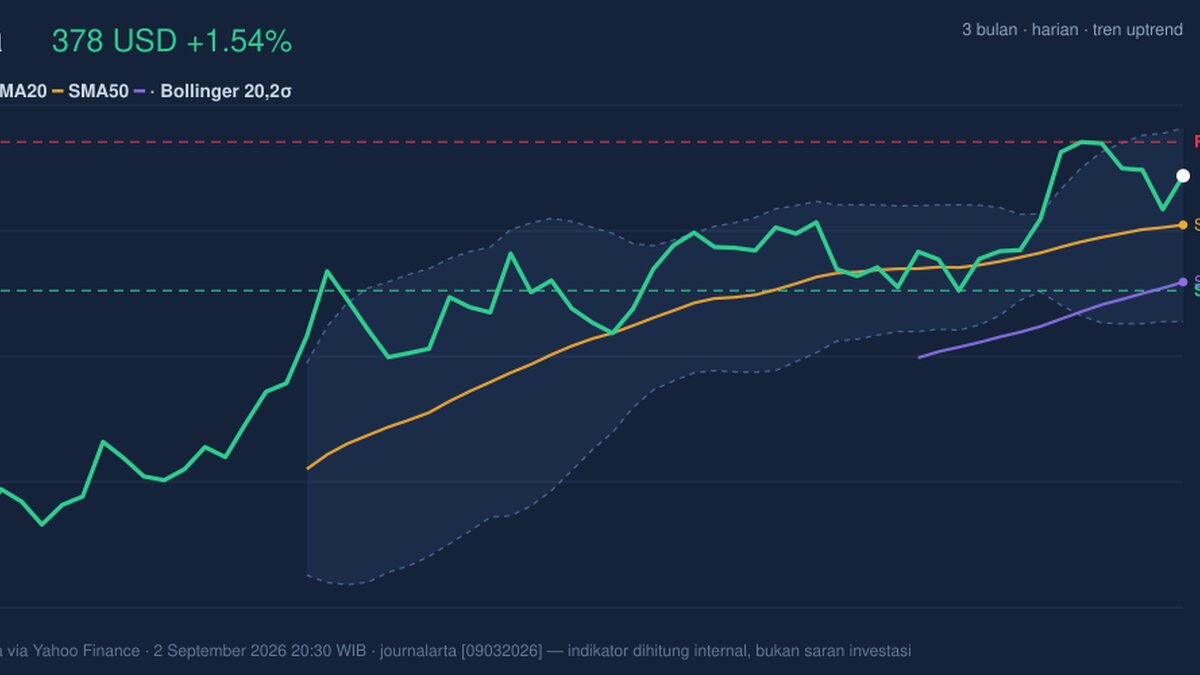
Visa’s shares rose to 378.40 USD in the latest New York session, up 1.54% from the prior close, and the move keeps the stock comfortably above its short- and medium-term trend lines. The chart shows a market that is still being carried by an uptrend, but one that is now trading closer to the upper end of its recent range, which matters because strength near resistance often tells a different story from strength near support.
Trend & Price Action
The most important signal here is that Visa remains above both its SMA20 at 370.03 and SMA50 at 360.31. That positioning tells readers the stock is not merely bouncing; it is trading above the levels that many short- and intermediate-term investors use to judge whether momentum is intact. The SMA20 slope of 0.78% over five days reinforces that point, showing the shorter trend is still rising rather than flattening out.
There is no fresh MA-cross, so the chart is not flashing a new trend-change event. Instead, it is showing continuity: the faster average remains above the slower one, and the absence of a new crossover suggests the recent move is more about follow-through than a dramatic shift in character. As shown in the chart, price is also sitting at 77% of the 20-hour range, which means Visa is leaning toward the top of its near-term band rather than probing the lower end.
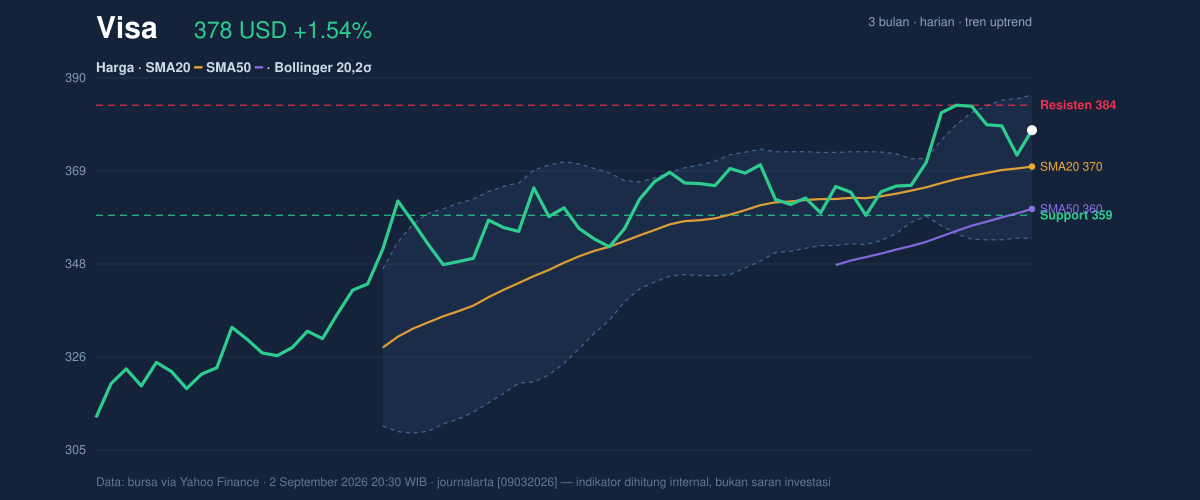
That placement matters because the stock is approaching resistance at 384.14, while the nearby support at 358.84 gives the market a clear floor to test if momentum fades. The broader three-month range, from 309.00 to 385.57, shows how much of the recovery has already been captured. Visa is now trading just beneath that upper boundary, so the market is asking whether buyers have enough conviction to extend the move or whether the stock pauses near the ceiling.
Oscillators & Momentum
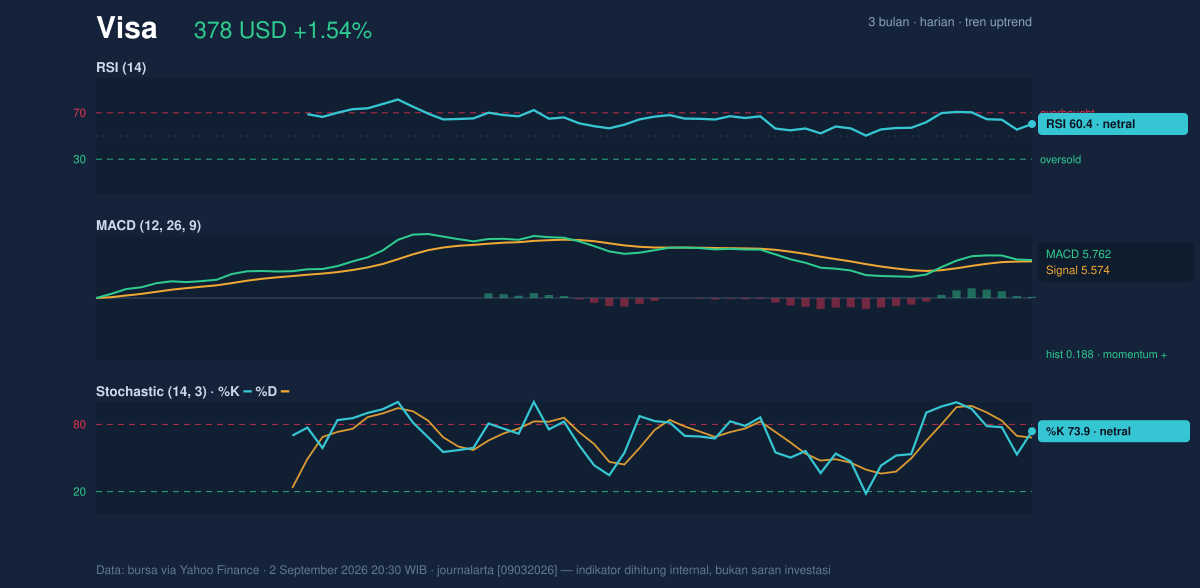
The momentum picture is constructive, but not overheated. RSI at 60.4 sits in neutral territory, which means the stock is not stretched enough to imply immediate exhaustion, yet it is also not cheap in momentum terms. That is often the profile of a healthy trend: positive, but not euphoric.
The stochastic reading tells a similar story. %K at 73.9 and %D at 68.2 are both in neutral-to-better-than-neutral territory, suggesting buyers still control the short-term swing, but without the kind of extreme reading that usually accompanies a sharp breakout or a crowded trade. In plain language, the stock has room, but it is no longer early in the move.
The clearest confirmation comes from MACD. MACD at 5.762 sits above the signal line at 5.574, with a positive histogram of 0.188. That alignment means the trend is still receiving momentum support rather than losing it. As shown in the momentum chart, the indicator structure is not screaming reversal; it is saying the current advance still has internal backing.
Volatility & Volume
Volatility is moderate rather than explosive. The ATR of 6.38, equal to 1.7% of price, suggests typical daily movement is contained enough for the stock to trend without wild swings, but large enough that traders should expect normal intraday pullbacks. The Bollinger Band width of 8.9% is described as normal, which is important because it argues against a squeeze that might foreshadow a sudden expansion, and against a panic-like widening that would signal stress.
Visa is trading at a %B of 75%, meaning price is in the upper portion of its Bollinger envelope. That is a bullish location, but it also signals that the stock is closer to the top band at 386.49 than to the middle at 370.03. When a stock sits in the upper band while momentum remains positive, it often implies trend persistence; when volume is light, the message becomes more cautious.
And volume is light. The latest reading of 5,599,900 shares is only 0.8x normal versus the 20-hour average of 6,772,970. That matters because price gains are usually more convincing when they are backed by heavier participation. The encouraging counterpoint is that OBV is rising, which suggests cumulative buying pressure has still been building even if the most recent session did not come with standout turnover. In other words, participation has not vanished, but the market has not yet shown a surge of conviction either.
Key Levels & Scenarios
The immediate technical map is clear. Resistance at 384.14 is the first test, and the broader upper Bollinger band at 386.49 frames the next ceiling if that first hurdle gives way. On the downside, support at 358.84 lines up closely with the SMA20 at 370.03, creating a layered zone where buyers would likely want to defend the trend.
If Visa clears 384.14 with better volume, the chart would be signaling that the stock is trying to convert a range-top into a new base. If it fails there, the more likely read is a pause or a pullback toward the middle band at 370.03, where the trend would be retested rather than broken. A fall through 358.84 would be more serious, because it would mean the stock has lost the lower edge of its recent trading structure and would weaken the case that the uptrend is still in force.
Technical Verdict: HOLD (wait & see)
HOLD (wait & see) fits best because the trend is still positive, but price is close to resistance and volume has not confirmed the latest push.
- MACD remains positive, with the line above signal and a green histogram, so momentum is still supportive.
- Price is above SMA20 and SMA50, which keeps the broader trend intact.
- %B at 75% places the stock near the upper part of its Bollinger range, so upside continuation is possible but not yet confirmed by volume.
Verdict invalidated if price falls below 358.84, because that would break the nearest support and weaken the current trend structure.
- Ideal Entry Range: 370.03 to 358.84
- Exit Target: 384.14 to 386.49
- Stop Loss protection: below 358.84
For non-traders, this means Visa still looks technically firm, but the chart is asking for proof before the next leg higher.
Summary Data Visa
| Last price | 378.40 USD |
| Change 1 day / 5 days / 1 month | 1.54% / -1.49% / 2.38% |
| Trend / MA-cross | uptrend / none |
| SMA20 / SMA50 | 370.03 / 360.31 |
| RSI (14) / Stochastic %K | 60.4 / 73.9 |
| Bollinger %B / ATR | 75% / 6.38 |
| Support / Resistance 20 days | 358.84 / 384.14 |
| Data as of | 2 September 2026 20:30 WIB |
Track Visa stock price daily: live levels, support/resistance and our full Visa analysis history.