AIA Stock Gains 1.71%, Testing Key Resistance In Focus
On September 4, 2026: price 77.30 HKD, trend sideways, RSI 59.5, support 70.40, resistance 77.30. technical analysis of aia stock. AIA Stock Gains — full…
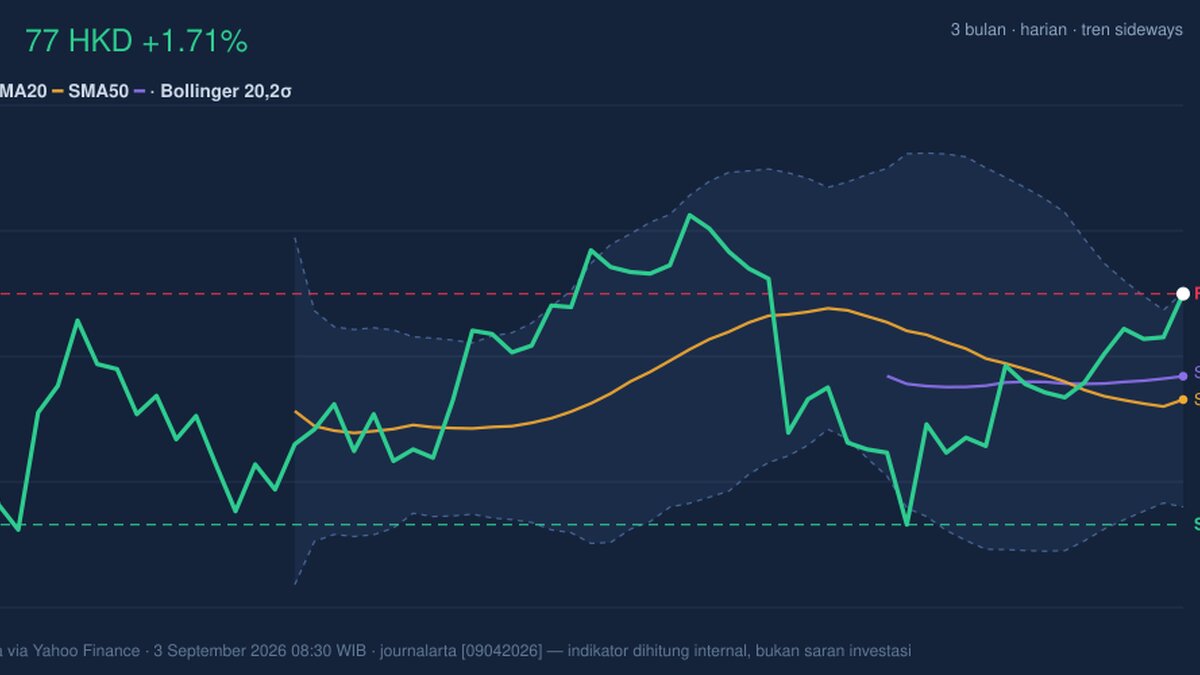
AIA Group’s shares rose to HK$77.30 in Hong Kong on 3 September, up 1.71% from the previous close of HK$76.00, and the move carried the stock to the very top of its short-term trading band, as shown in the chart. That matters because the latest print is not just a daily bounce: it places the stock at 100% of its 20-day range, with price brushing the upper Bollinger band and momentum indicators sending mixed but mostly constructive signals.
Trend & Price Action
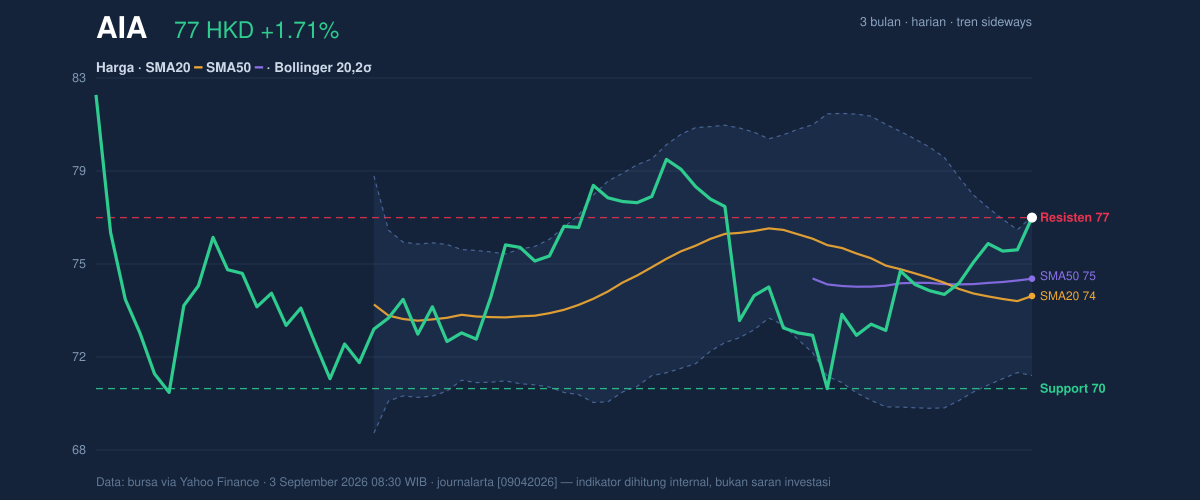
The broader setup is still best described as sideways, not trending, even though the price is now above both the SMA20 at HK$74.14 and the SMA50 at HK$74.84. That positioning tells traders the recent recovery has pushed AIA back above its short-term and medium-term averages, a sign that sellers have lost some control. But the slope of the SMA20 is still -0.39% over 5 days, which means the average itself is edging lower. In plain terms, the stock has improved faster than its trend has. That is a useful distinction.
There is also no fresh moving-average cross, so the chart does not yet show a decisive trend reversal. The price is sitting near the top of the range between the 20-hour support at HK$70.40 and 20-hour resistance at HK$77.30. As shown in the chart, that leaves little room overhead before the stock meets immediate resistance again. The 3-month range adds context: the share price is still below the 3-month high of HK$82.85 and well above the 3-month low of HK$69.05, which reinforces the idea of a recovery inside a broader consolidation.
Oscillators & Momentum
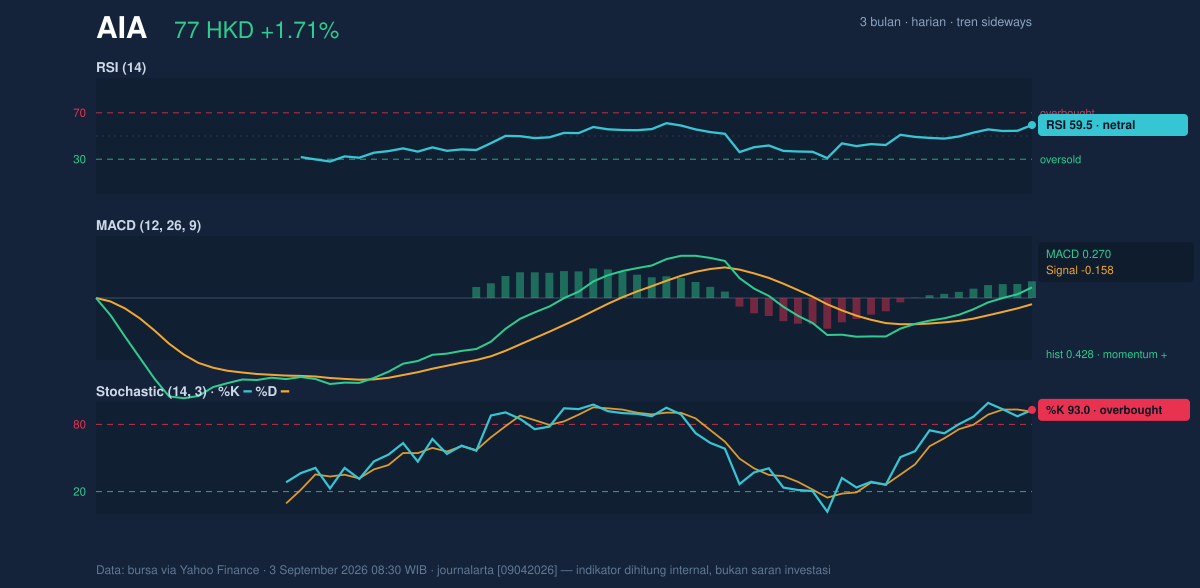
The momentum picture is more nuanced. The RSI at 59.5 sits in neutral territory, which usually suggests the stock is neither stretched nor washed out. That is important because it means the recent rise has not yet pushed the broader momentum gauge into an extreme. By contrast, the Stochastic %K at 93.0 and %D at 91.2 are both in overbought territory. Stochastic tends to react quickly to short-term price acceleration, so this reading says the rally has moved fast enough that a pause or consolidation would not be surprising.
The MACD at 0.270, with the signal line at -0.158 and a positive histogram of 0.428, points the other way. MACD is still confirming upward momentum, and the positive histogram means the gap between the MACD line and the signal line is widening in a bullish direction. That combination matters: RSI is neutral, Stochastic is stretched, and MACD is positive. In practical terms, the stock has upside momentum, but the short-term oscillator is warning that the pace may be ahead of itself. That is a classic setup for strength with caution rather than an outright breakout signal.
Volatility & Volume
Volatility is present, but not excessive. The ATR at 1.91, equal to 2.5% of price, suggests a moderate daily swing range. That means the stock can move, but not in a disorderly way. The Bollinger Bands help explain the current tension. Price is pressing the upper band at HK$77.34, while the middle band sits at HK$74.14 and the lower band at HK$70.93. With %B at 99% and band width at 8.6%, the stock is trading almost exactly at the top edge of its recent volatility envelope. That is usually a sign of strength, but it also leaves the price vulnerable to mean reversion if buyers fail to extend the move.
Volume does not fully confirm the push higher. The latest turnover of 21,112,248 was only 0.7x the 20-hour average of 31,364,830. In other words, the stock reached the top of its range without above-average participation. That is not a bearish signal on its own, but it does mean the breakout attempt lacks strong volume backing. The improving OBV, however, shows that cumulative volume flow is still rising, so the broader participation trend has not rolled over. The signal is mixed: price is strong, but the crowd is not yet piling in aggressively.
Key Levels & Scenarios
The chart leaves a narrow technical corridor. The most immediate resistance is HK$77.30, which is also the latest price, and the upper Bollinger band at HK$77.34 sits just above it. That makes the current area a test of commitment rather than a clean breakout. If the stock can hold above this zone, the next reference point is the 3-month high at HK$82.85. If it cannot, the first meaningful downside marker is the SMA20 at HK$74.14, followed by the SMA50 at HK$74.84 and then the 20-hour support at HK$70.40. The lower Bollinger band at HK$70.93 aligns closely with that lower support area, which makes the band a useful warning line for fading momentum.
The key signal is that price is already at the top of the short-term range, while oscillators are split between overbought Stochastic and positive MACD. That usually means the next move matters more than the last one. A clean hold above the current resistance zone would keep the recovery alive. A slip back below the moving averages would tell the market the move was only a short squeeze rather than a trend change.
Technical Verdict: HOLD (wait & see)
HOLD (wait & see)
- RSI is neutral at 59.5, so the stock is not overextended on the broader momentum gauge.
- MACD remains positive with a 0.428 histogram, which supports the recent recovery.
- But Stochastic is overbought and price is already at HK$77.30, right on resistance and the upper Bollinger band, so upside follow-through is not yet confirmed.
Verdict invalidated if price falls below HK$74.14, where the SMA20 sits and short-term support would begin to fail.
- Ideal Entry Range: HK$74.14 to HK$74.84
- Exit Target (Target Price): HK$82.85
- Stop Loss protection: HK$70.40
In plain English, the chart says the stock has improved, but it still needs proof that the move can last.
Summary Data AIA
| Last price | 77.30 HKD |
| Change 1 day / 5 days / 1 month | 1.71% / 3.55% / 5.67% |
| Trend / MA-cross | sideways / none |
| SMA20 / SMA50 | 74.14 / 74.84 |
| RSI (14) / Stochastic %K | 59.5 / 93.0 |
| Bollinger %B / ATR | 99% / 1.91 |
| Support / Resistance 20 days | 70.40 / 77.30 |
| Data as of | 3 September 2026 08:30 WIB |
Track AIA share price daily: live levels, support/resistance and our full AIA analysis history.