Barclays Stock Gains 0.06%, Momentum Gains In Focus
On October 16, 2026: price 432.65 GBp, trend downtrend, RSI 34.9, support 426.15, resistance 471.10. technical analysis of barclays stock.
Trend & Price Action
The shares are below both their 20-day simple moving average (SMA) of 446.56 GBp and 50-day SMA of 476.12 GBp. The shorter average is sloping down, reinforcing the near-term weakness; there has been no new crossover between the averages to signal a change in trend. At 432.65 GBp, Barclays is also near the lower end of its three-month range of 420.45–538.30 GBp. The price has gained 0.70% over five days but remains down 6.39% over one month. That contrast points to a tentative pause rather than a confirmed recovery: a short bounce is unfolding inside a broader decline. The chart shows how far the price remains below its moving averages, while placing it near the lower Bollinger band and the stated support zone.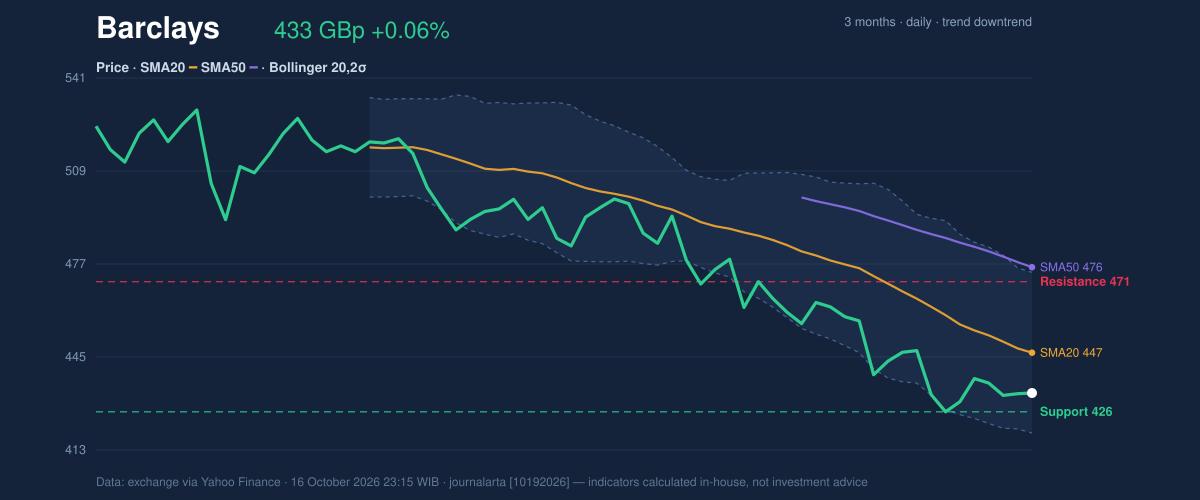
Oscillators & Momentum
Momentum indicators are sending mixed signals. RSI is 34.9, in neutral territory, so it does not yet show a decisive oversold reading. The stochastic oscillator, which compares recent closes with the recent trading range, is more stretched: %K at 14.8 and %D at 17.7 are in oversold territory. That can precede a rebound, but it does not establish one on its own. MACD adds a small positive signal within a weak broader structure. MACD remains negative at -13.293, but its histogram is positive at 0.361, with the MACD line above its signal line. In plain terms, downward momentum may be easing, although the indicator has not crossed into positive territory. The chart helps distinguish that early momentum improvement from a full trend reversal: RSI and stochastic remain weak, while MACD’s positive histogram is a nascent counter-signal.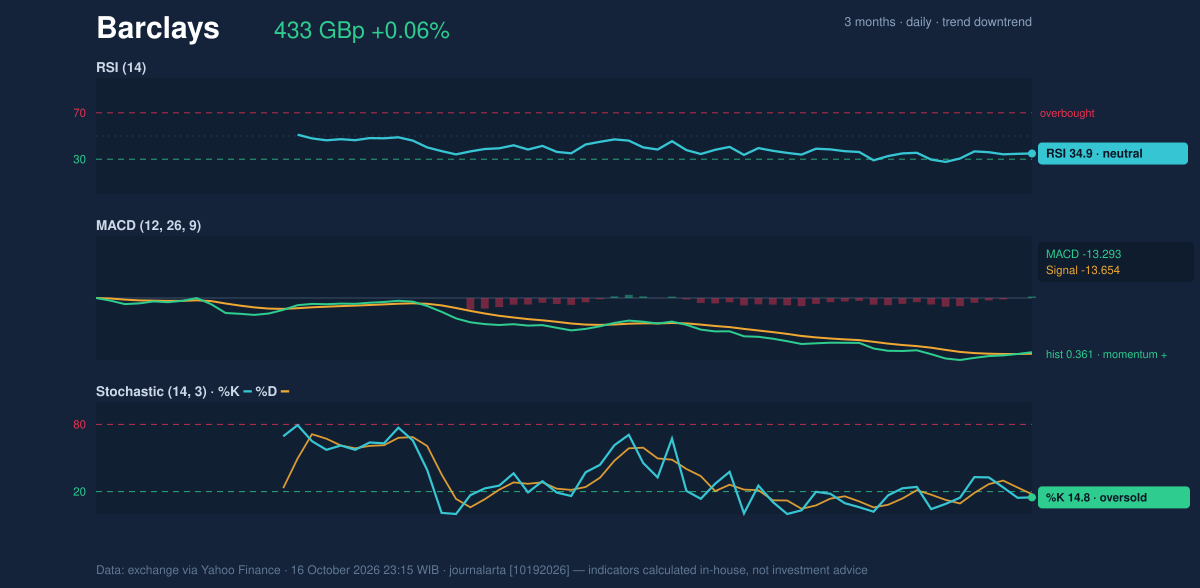
Volatility & Volume
The Bollinger bands place the shares closer to the lower boundary than the upper one: the lower band is 418.79 GBp, the middle band 446.56 GBp and the upper band 474.34 GBp. %B of 25% signals a position in the lower part of the band, while the 12.4% width is normal rather than unusually compressed. There is no squeeze signal suggesting volatility has been unusually subdued before a breakout. Volatility remains material. ATR, an estimate of typical price movement, is 15.57 GBp, or 3.6% of the share price. The 71.6 million shares traded were 1.8 times the 20-day average, and OBV rose. The combination indicates heavier participation with a buying tilt, but the price’s marginal daily gain means that demand has not yet pushed it through resistance.Technical Verdict: HOLD (wait & see)
HOLD (wait & see) fits the balance of evidence: the downtrend and position below both moving averages argue against calling a reversal, while oversold stochastic readings, a positive MACD histogram and rising OBV leave room for a recovery attempt. The verdict is invalidated if the price falls below 426.15 GBp, the stated 20-day support.- Ideal Entry Range: 426.15–446.56 GBp, around support and up to the 20-day SMA; the indicators do not confirm a reversal within this zone.
- Exit Target (Target Price): 471.10 GBp, the stated 20-day resistance.
- Stop Loss: Below 418.79 GBp, the lower Bollinger band, with the nearby support at 426.15 GBp as the earlier invalidation level.
Data table — BARC.L, source: exchange data via Yahoo Finance, as of 16 October 2026 23:15 WIB
Why Barclays is in focus today
- Volume at 1.8× the 20-day average
Selected automatically from 16 LSE (UK) stocks by a technical-signal score with daily weighted randomisation — not a recommendation.
| Last price | 432.65 GBp |
| Daily / five-day / one-month change | +0.06% / +0.70% / -6.39% |
| SMA20 / SMA50 | 446.56 / 476.12 GBp |
| Bollinger lower / middle / upper | 418.79 / 446.56 / 474.34 GBp |
| RSI / Stochastic %K, %D | 34.9 / 14.8, 17.7 |
| MACD / signal / histogram | -13.293 / -13.654 / 0.361 |
| ATR | 15.57 GBp |
| Latest volume / 20-day average | 71,568,901 / 40,138,923 |
| Support / resistance | 426.15 / 471.10 GBp |
| Three-month high / low | 538.30 / 420.45 GBp |
Summary Data Barclays
| Last price | 432.65 GBp |
| Change 1 day / 5 days / 1 month | 0.06% / 0.70% / -6.39% |
| Trend / MA-cross | downtrend / none |
| SMA20 / SMA50 | 446.56 / 476.12 |
| RSI (14) / Stochastic %K | 34.9 / 14.8 |
| Bollinger %B / ATR | 25% / 15.57 |
| Support / Resistance 20 days | 426.15 / 471.10 |
| Data as of | 16 October 2026 23:15 WIB |
Disclaimer: This technical analysis is generated automatically from exchange data (via Yahoo Finance) and indicators calculated by JournalArta, for information and education only. The verdict and the entry, target and stop-loss levels are not investment advice or a solicitation to buy or sell any security. Investment decisions and their risks rest solely with the reader.
Track Barclays share price daily: live levels, support/resistance and our full Barclays analysis history.