BP Stock Gains 0.59%, RSI Overbought In Focus
On October 16, 2026: price 614.10 GBp, trend uptrend, RSI 72.0, support 542.30, resistance 614.20. technical analysis of bp stock. BP Stock Gains — full…
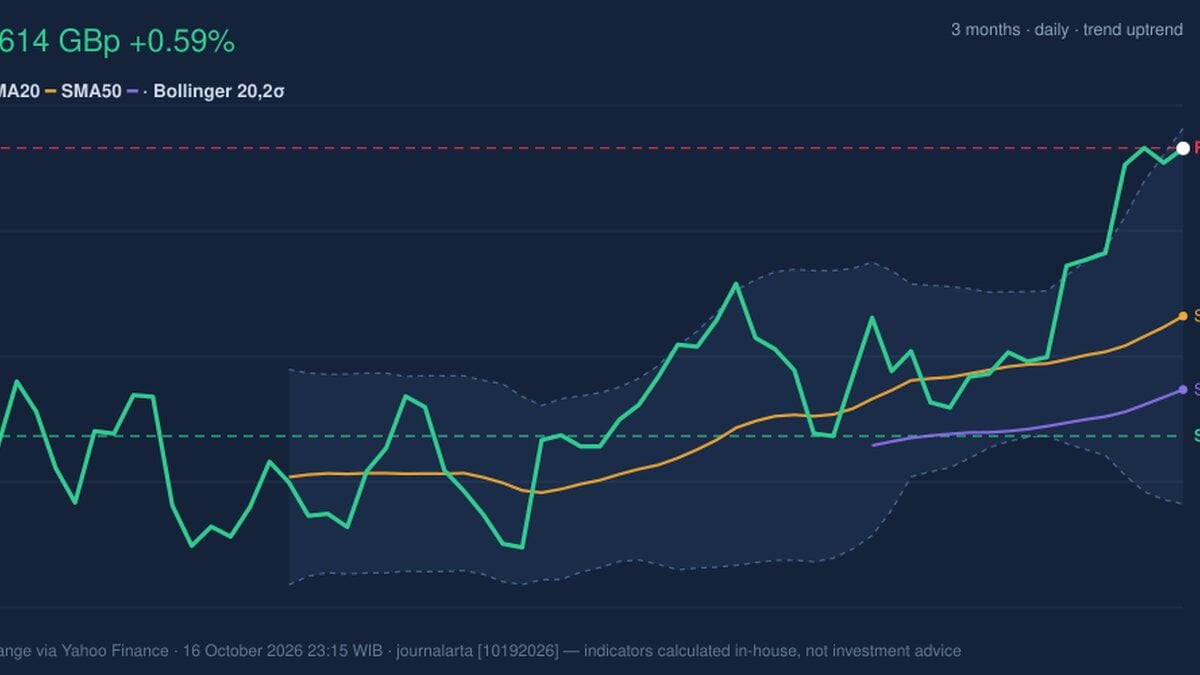
Why BP is in focus today
- Volume at 2.3× the 20-day average
- Trading near its 3-month high (616.70)
- RSI(14) at 72.0 — overbought zone
- Uptrend confirmed (5-day change 4.74%)
Selected automatically from 16 LSE (UK) stocks by a technical-signal score with daily weighted randomisation — not a recommendation.
Trend & Price Action
BP gained 0.59% on the day, extending its rise to 4.74% over five trading days and 9.92% over one month, according to market data sourced from the exchange via Yahoo Finance as of 16 October 2026. The share price is above both its 20-day simple moving average (SMA), at 572.26 pence, and its 50-day SMA, at 553.91 pence. A simple moving average smooths recent prices to make the underlying direction easier to see; here, the positioning supports an established upward trend, rather than a new moving-average crossover. The 20-day average is rising, with its slope up 1.74% over five days. BP is also near the top of its three-month range: the high is 616.70 pence and the low is 502.80 pence. The day’s gain therefore adds to a strong trend, but leaves little room before the nearest marked resistance. The 20-day resistance is 614.20 pence, almost level with the last price. The share is at 100% of its reported 20-day range, a sign that buyers have driven it to the range’s upper boundary—not proof that the boundary has been cleared.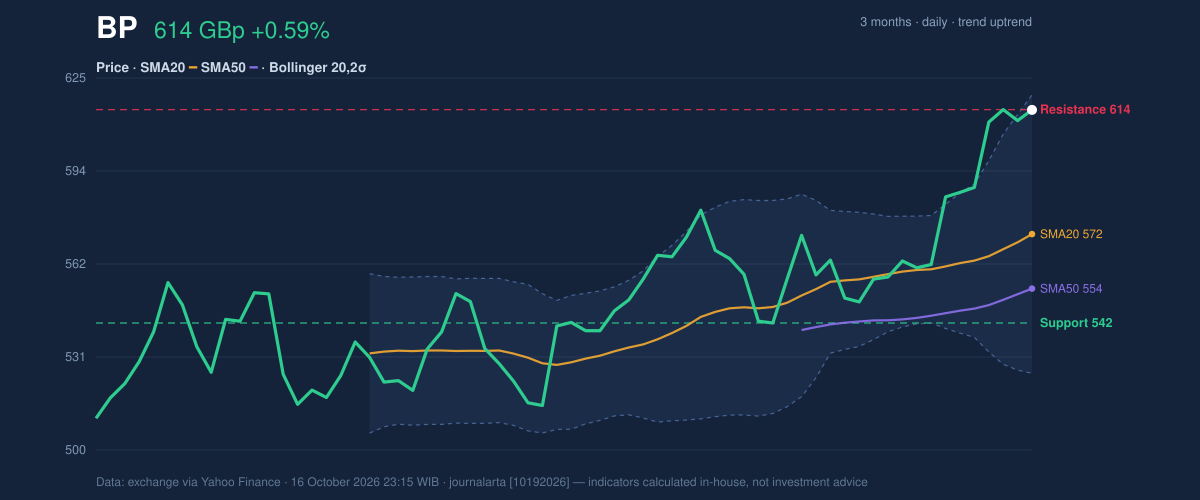
Oscillators & Momentum
The momentum indicators agree that buying pressure is strong, but they also show an increasingly crowded trade. The RSI is 72.0, in overbought territory. RSI compares the scale of recent gains with recent losses; a high reading can persist during a rally, but it raises the risk of a pause or pullback. The Stochastic readings, %K at 96.7 and %D at 95.8, are also overbought, placing both measures near the top of their recent ranges. That warning has not yet been confirmed by a momentum reversal. The MACD is positive at 15.898, above its 10.961 signal line, with a positive 4.937 histogram. MACD compares shorter- and longer-term price momentum; its current configuration indicates that the upward move still has momentum behind it. In other words, BP’s indicators point in two directions at once: the trend remains positive, while the pace of gains leaves the shares vulnerable to a breather.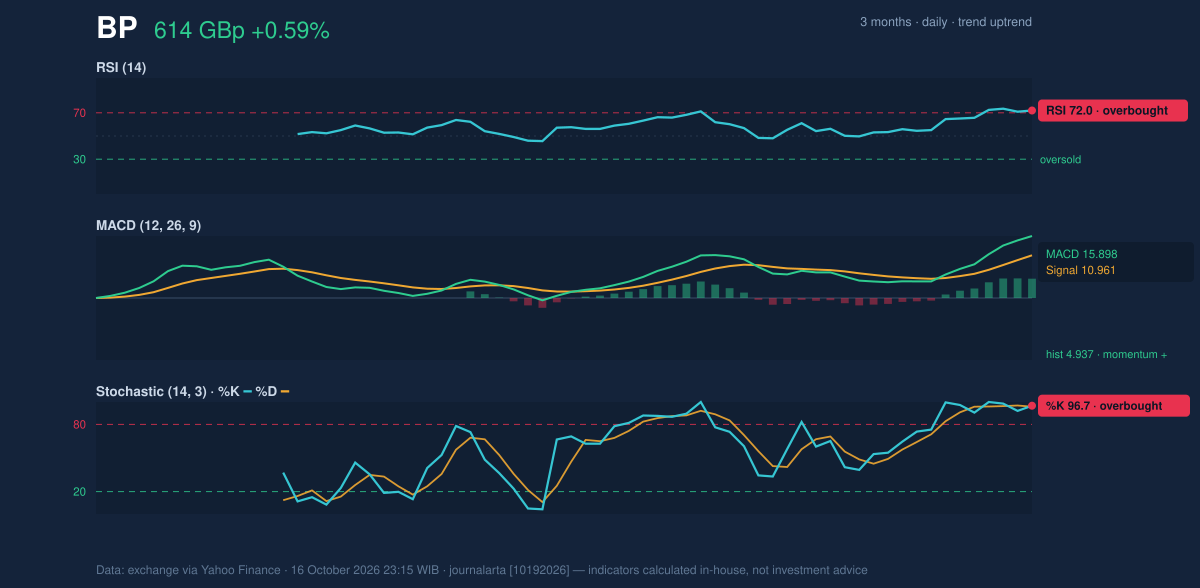
Volatility & Volume
Trading volume reached 99,077,085 shares, or 2.3 times the 20-day average of 43,428,425. The accompanying rise in OBV—a running measure that adds volume on up days and subtracts it on down days—suggests the rally has drawn broader participation, rather than relying solely on a thin session. Volume strengthens the case that buyers were active, although it does not remove the resistance test. The Bollinger Band position reinforces the tension. BP’s %B is 95%, meaning the price is close to the upper band at 619.15 pence; the middle band is 572.26 pence and the lower band is 525.37 pence. Bollinger Bands widen or narrow with price variability, and the reported 16.4% width is normal rather than unusually tight or expanded. A price near the upper band can reflect strong momentum, but it also means the share is trading near the upper edge of its recent statistical range. The ATR is 14.66 pence, or 2.4% of the share price, indicating moderate daily price movement. That matters for risk: even a continuing uptrend can include meaningful short-term swings.Key Levels & Scenarios
A sustained move beyond 614.20 pence resistance would put the three-month high of 616.70 pence in focus as the next nearby reference from the supplied data. Failure to hold near resistance, by contrast, could leave the shares exposed to a retreat toward the 20-day average at 572.26 pence. The reported 20-day support at 542.30 pence is a deeper reference level; a break below it would materially weaken the current technical structure.Technical Verdict: HOLD (wait & see)
HOLD (wait & see) fits the mixed technical evidence: the price is above rising moving averages, volume and OBV confirm participation, and MACD remains positive. Against that, RSI and Stochastic are both overbought, while the price is testing resistance near the three-month high. - Ideal Entry Range: 572.26–553.91 pence, around the 20-day and 50-day averages, if a pullback holds those trend references. - Exit Target (Target Price): 616.70 pence, the three-month high and the closest supplied reference above resistance. - Stop Loss protection: 542.30 pence, the reported 20-day support. - Invalidation: The verdict is invalidated if the price falls below 542.30 pence. For non-traders, the indicators show an intact uptrend, but the shares are close to resistance and may need to pause before the next move.| Indicator | Reading |
|---|---|
| Last price | 614.10 GBp |
| 20-day / 50-day SMA | 572.26 / 553.91 |
| RSI / Stochastic | 72.0 / 96.7 and 95.8 |
| MACD / signal | 15.898 / 10.961 |
| Support / resistance | 542.30 / 614.20 GBp |
Summary Data BP
| Last price | 614.10 GBp |
| Change 1 day / 5 days / 1 month | 0.59% / 4.74% / 9.92% |
| Trend / MA-cross | uptrend / none |
| SMA20 / SMA50 | 572.26 / 553.91 |
| RSI (14) / Stochastic %K | 72.0 / 96.7 |
| Bollinger %B / ATR | 95% / 14.66 |
| Support / Resistance 20 days | 542.30 / 614.20 |
| Data as of | 16 October 2026 23:15 WIB |
Disclaimer: This technical analysis is generated automatically from exchange data (via Yahoo Finance) and indicators calculated by JournalArta, for information and education only. The verdict and the entry, target and stop-loss levels are not investment advice or a solicitation to buy or sell any security. Investment decisions and their risks rest solely with the reader.
Track BP share price daily: live levels, support/resistance and our full BP analysis history.