Alibaba Stock Drops 2.18% Today, Testing Support Level
On September 4, 2026: price 107.50 HKD, trend sideways, RSI 36.2, support 107.50, resistance 126.70. technical analysis of alibaba stock.
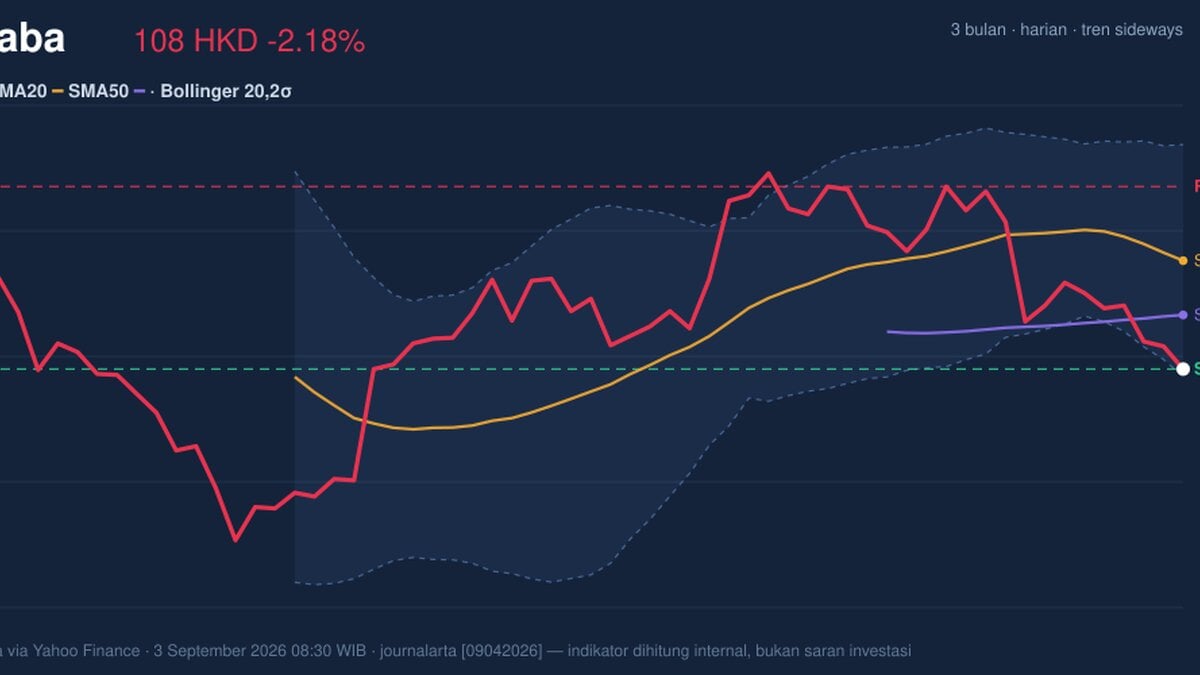
Alibaba Group’s Hong Kong-listed shares fell to HKD 107.50 on the HKEX, extending a slide that has taken the stock 2.18% lower in one day, 6.93% over five days and 13.59% over one month, according to exchange-linked market data as of 3 September 2026 08:30 WIB. The move matters because it is not just a one-session wobble: the price is now sitting below the 20-day moving average of HKD 118.91 and also below the 50-day moving average of HKD 113.21, which tells traders the stock has lost near-term and medium-term traction at the same time. In plain terms, the market is no longer paying up for the shares on momentum alone.
Trend & Price Action
The chart shows a stock that is still trapped in a sideways trend, but with the slope of the SMA20 down 2.64% over five days, the “sideways” label is starting to look more like a downward drift than a neutral pause. That distinction matters. A flat range can be healthy consolidation; a falling short-term average inside a range often means sellers are using rallies to exit rather than buyers stepping in aggressively. The latest close at HKD 107.50 is also positioned at the bottom of the 20-hour range, with the stock at 0% of that range between HKD 107.50 support and HKD 126.70 resistance. That is a weak position: the market is hugging the floor, not probing for a breakout.
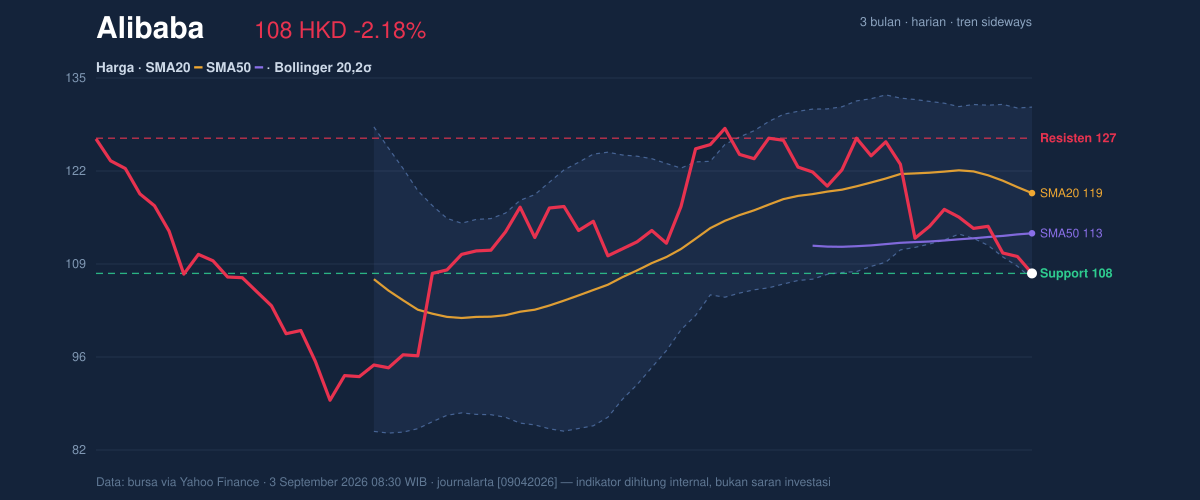
The broader context is equally important. Over the past three months, Alibaba’s Hong Kong line has traded between HKD 130.30 and HKD 88.65, and the current price is much closer to the lower half of that band than the upper edge. That usually signals the market is still repairing a prior down move rather than building a fresh uptrend.
A range can hold for a while. But the burden of proof is now on the buyers.
Oscillators & Momentum
The momentum gauges are mixed, but not in a reassuring way. The RSI(14) at 36.2 is technically still neutral, yet it is close enough to oversold territory to show the stock has been under persistent pressure. More telling is the Stochastic %K at 4.3 and %D at 6.8, both in oversold territory. Stochastic measures where the price sits within its recent range, so readings this low usually mean the stock has been pressed toward the bottom of that range for long enough that a reflex bounce becomes possible. That is not the same as a trend reversal. It is a warning that the decline is stretched.
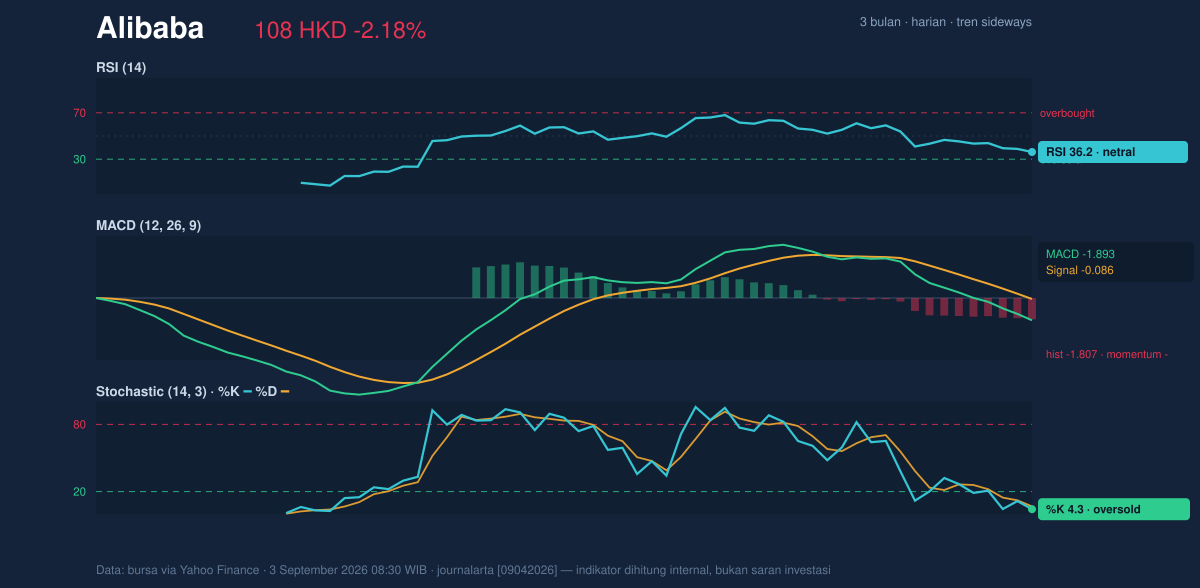
The bigger issue is the MACD at -1.893, with the signal line at -0.086 and a histogram of -1.807. MACD below zero means trend momentum is negative; a deeply negative histogram means that negative momentum is still expanding rather than fading. In other words, the oversold oscillator is hinting at exhaustion, but the trend-following indicator is still arguing that sellers remain in control. When those two disagree, the trend indicator usually deserves more weight until price action confirms a turn.
Volatility & Volume
Volatility is elevated. The Bollinger Bands are wide, with the upper band at HKD 131.12, the middle band at HKD 118.91 and the lower band at HKD 106.71. The %B at 3% shows the stock is trading very near the lower band, a classic sign that the market is stretched to the downside. At the same time, the band width of 20.5% is expanding, which means the price swings are becoming larger, not smaller. Combine that with ATR(14) of 4.77, or 4.4% of price, and the message is clear: the stock can move sharply in either direction from here, but the current bias remains weak until buyers prove otherwise.
Volume does not yet confirm a durable bottom. The latest turnover of 69,972,408 shares is only 0.7× the 20-hour average of 97,557,526, and OBV is falling. OBV, or on-balance volume, tracks whether volume is flowing into the stock or out of it; a declining OBV says the recent price weakness has been accompanied by net distribution rather than accumulation. That is a problem for any bounce attempt, because rebounds built on thin participation often fade quickly.
Key Levels & Scenarios
The immediate technical map is straightforward. The first line to watch is HKD 107.50, which is both the last price and 20-hour support. Just below that sits the Bollinger lower band at HKD 106.71, which acts as a volatility-based floor. If that area fails, the chart opens the door to a deeper test of the lower part of the recent three-month range, where the next reference is the HKD 88.65 low.
On the upside, the stock needs to reclaim HKD 113.21 first, then HKD 118.91, because those are the 50-day and 20-day moving averages. Those levels matter more than a single intraday bounce because moving averages reflect where the market has been willing to trade over a longer stretch. Beyond that, the near-term ceiling is HKD 126.70 resistance; a move there would show the market has not only stabilized but also recovered enough demand to challenge the upper half of the range.
Technical Verdict: HOLD (wait & see)
HOLD (wait & see)
- RSI at 36.2 and Stochastic at 4.3/6.8 show the stock is near oversold, so downside may be stretched.
- MACD at -1.893 with a -1.807 histogram still shows negative momentum, so the trend has not turned.
- Price below SMA20 at HKD 118.91 and SMA50 at HKD 113.21, with OBV falling, means rallies lack confirmation.
Invalidation condition: this verdict is invalidated if price falls below HKD 106.71, the lower Bollinger Band.
- Ideal entry range: HKD 106.71 to HKD 113.21
- Exit target: HKD 118.91, then HKD 126.70
- Stop loss protection: below HKD 106.71
For non-traders, this means the shares are stretched enough to bounce, but not strong enough yet to prove the decline is over.
Alibaba’s latest HKEX close was HKD 107.50.
Summary Data Alibaba
| Last price | 107.50 HKD |
| Change 1 day / 5 days / 1 month | -2.18% / -6.93% / -13.59% |
| Trend / MA-cross | sideways / none |
| SMA20 / SMA50 | 118.91 / 113.21 |
| RSI (14) / Stochastic %K | 36.2 / 4.3 |
| Bollinger %B / ATR | 3% / 4.77 |
| Support / Resistance 20 days | 107.50 / 126.70 |
| Data as of | 3 September 2026 08:30 WIB |
Track Alibaba share price daily: live levels, support/resistance and our full Alibaba analysis history.