AstraZeneca Stock Analysis: Gains 1.54%, Momentum Gains
On September 4, 2026: price 12,146.00 GBp, trend sideways, RSI 45.2, support 11,460.00, resistance 12,476.00. technical analysis of astrazeneca stock.
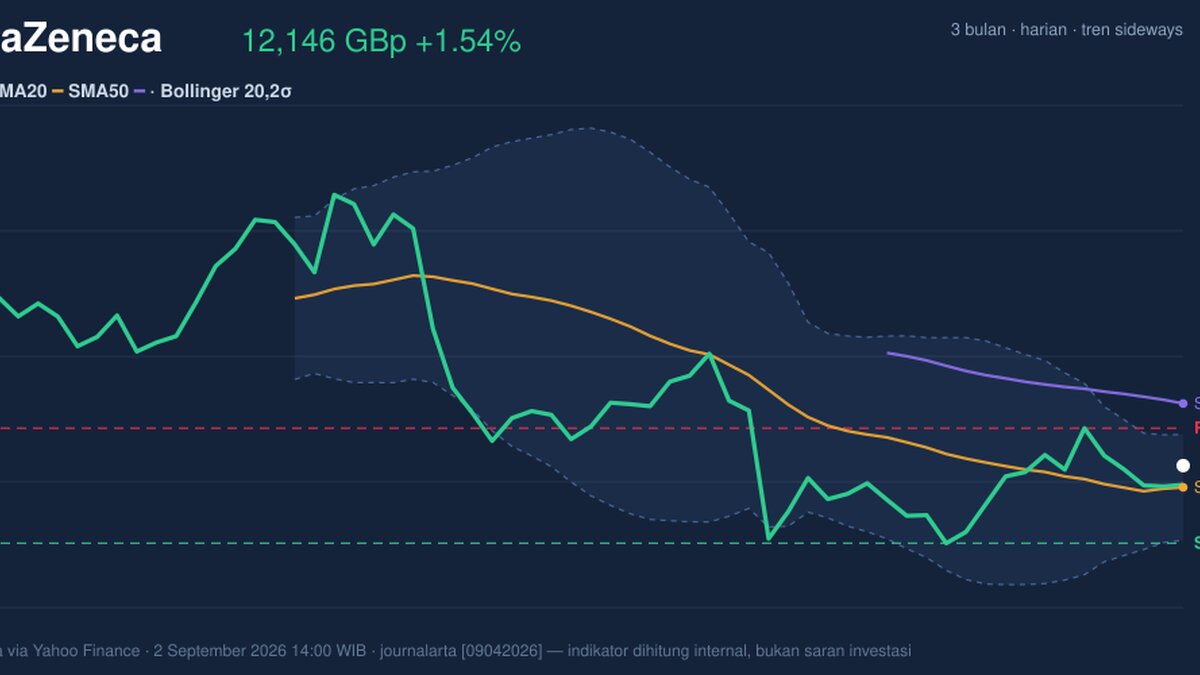
Shares in AstraZeneca on the London Stock Exchange were last quoted at 12,146.00 GBp, up 1.54% on the day, after the stock moved back above its 20-day average but still sat well below its 50-day line, according to data from Yahoo Finance via the exchange feed at 2 September 2026 14:00 WIB. That combination matters: it says the rebound is real enough to reclaim short-term trend support, but not yet strong enough to declare a clean medium-term trend change. The stock is still trading in a sideways structure, and the latest price action looks more like a test of range boundaries than a decisive breakout.
Trend & Price Action
The most important signal in the chart is that price is above SMA20 at 11,953.60 but remains below SMA50 at 12,694.96. In plain terms, AstraZeneca has recovered from short-term weakness, yet the longer moving average still acts as overhead resistance. That is why the current setup reads as a range-bound recovery rather than a confirmed uptrend. The data also shows no fresh MA cross, so there is no new moving-average signal to suggest a major shift in character.
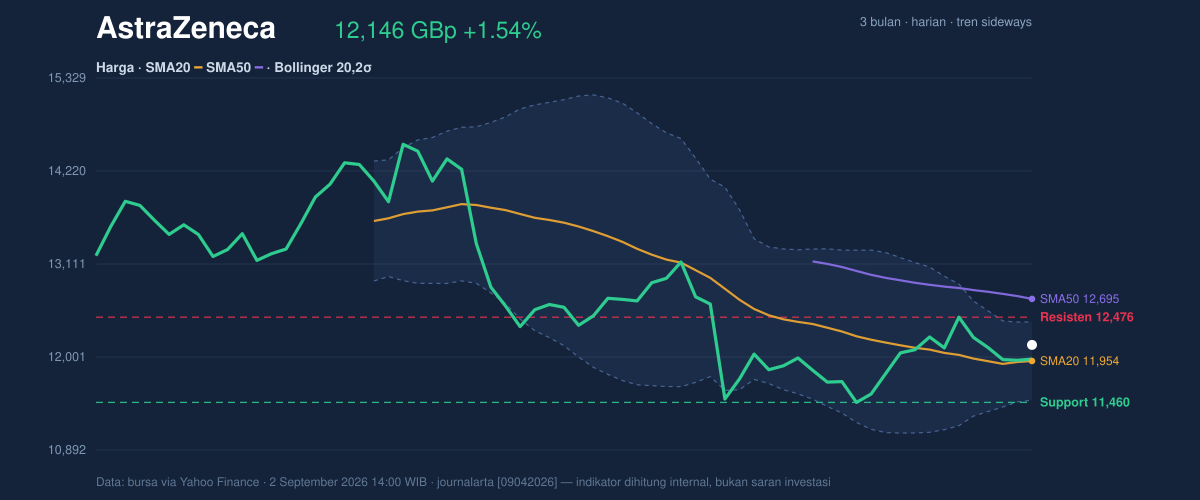
The stock is trading at around 68% of its 20-day range, with support at 11,460.00 and resistance at 12,476.00. That positioning is constructive, because it places the shares closer to the upper half of the range, but not yet at the ceiling. The 3-month range adds context: the stock is still far below the 3-month high of 15,126.00 and comfortably above the 3-month low of 9,892.00. That gap tells readers the shares have room to move in either direction, but the market has not yet committed to a full trend reset.
Oscillators & Momentum
The momentum picture is mixed, but not weak. RSI at 45.2 is neutral, which means the stock is neither stretched on the upside nor washed out on the downside. Stochastic %K at 53.4 and %D at 52.7 also sit in neutral territory, showing balance between buyers and sellers rather than an extreme condition. These readings matter because they suggest the recent bounce is not yet overbought, leaving some room for further gains if price can attract participation.
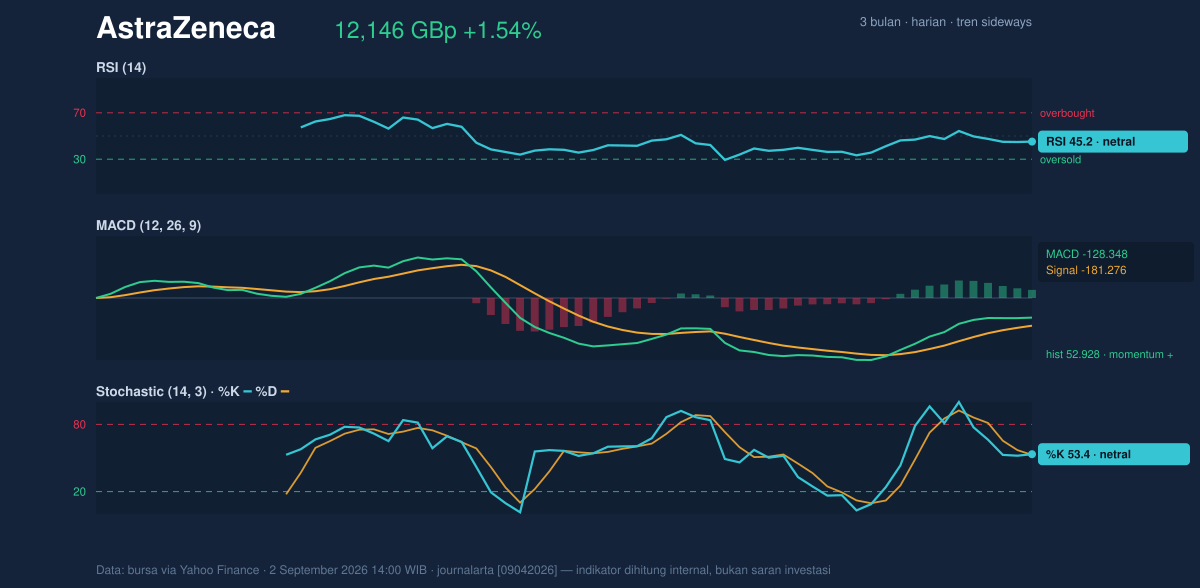
The more encouraging signal comes from MACD. MACD at -128.348 is still below zero, which means longer-term momentum has not fully turned positive. But the histogram at 52.928 is positive, and the MACD line sits above the signal line at -181.276. That combination usually indicates improving momentum beneath the surface: the stock may still be in a broader recovery process, even if the trend has not yet flipped decisively. In simple terms, the engine is getting stronger, but the car is still on a road with traffic ahead.
Volatility & Volume
Volatility is moderate rather than explosive. ATR(14) at 288.29, or 2.4% of price, suggests the stock is moving enough to create tradable swings, but not so violently that the chart looks disorderly. More importantly, Bollinger Bands are tightening: the 7.8% band width points to a squeeze, which often precedes a larger move. The current %B at 71% shows price is leaning toward the upper band, not pressing against it aggressively. That is a subtle but useful sign: the stock has upside bias within the range, yet it has not entered a full breakout condition.
Volume, however, is less supportive. Last trade volume of 2,766,204 was only 0.8x normal versus the 20-day average of 3,575,648, and OBV is falling. OBV, or on-balance volume, tracks whether trading activity is broadly accumulating or distributing shares. A declining OBV alongside a price rebound usually means the move has not yet won broad sponsorship. That does not cancel the rebound, but it does warn that follow-through could be fragile unless volume improves.
Key Levels & Scenarios
The nearest battleground is clear. Resistance at 12,476.00 lines up close to the upper Bollinger band at 12,420.52, while support at 11,460.00 sits below the 20-day average and near the lower part of the recent range. If price clears resistance with stronger participation, the chart would begin to shift from a sideways recovery toward a more convincing advance. If it fails there, the stock could slip back toward the middle of the range and test whether the 20-day average can continue to act as a floor.
The key signal to watch is not just direction, but confirmation. A move above resistance without volume would be less meaningful than a move that comes with stronger turnover and a firmer OBV trend. Conversely, a drop back below the 20-day average would weaken the current recovery setup and suggest the bounce was only corrective.
Technical Verdict: HOLD (wait & see)
HOLD (wait & see) fits the chart because the stock is above SMA20 at 11,953.60 and MACD momentum is improving, but SMA50 at 12,694.96 is still overhead and volume confirmation is lacking. The Bollinger squeeze argues that a larger move may be coming, yet the neutral RSI at 45.2 and Stochastic at 53.4/52.7 show the market has not chosen a clear direction. The verdict would be invalidated if price falls below 11,460.00, where nearby support sits.
- Ideal Entry Range: 11,953.60 to 12,146.00, where price sits above the 20-day average but before the upper range cap.
- Exit Target: 12,476.00, the nearest resistance and the first level that would signal a range break attempt.
- Stop Loss protection: 11,460.00, the key support that would invalidate the current rebound structure.
For non-traders, this means AstraZeneca’s chart is improving, but it still needs stronger confirmation before the next move can be trusted.
Volume last traded at 2,766,204 shares versus a 20-day average of 3,575,648, with OBV still declining.
Summary Data AstraZeneca
| Last price | 12,146.00 GBp |
| Change 1 day / 5 days / 1 month | 1.54% / -2.65% / 3.46% |
| Trend / MA-cross | sideways / none |
| SMA20 / SMA50 | 11,953.60 / 12,694.96 |
| RSI (14) / Stochastic %K | 45.2 / 53.4 |
| Bollinger %B / ATR | 71% / 288.29 |
| Support / Resistance 20 days | 11,460.00 / 12,476.00 |
| Data as of | 2 September 2026 14:00 WIB |
Track AstraZeneca share price daily: live levels, support/resistance and our full AstraZeneca analysis history.