CRM Stock Analysis: Gains 2.92%, RSI Overbought
On September 4, 2026: price 264.43 USD, trend uptrend, RSI 81.7, support 190.97, resistance 264.43. technical analysis of crm stock. CRM Stock Analysis — full…
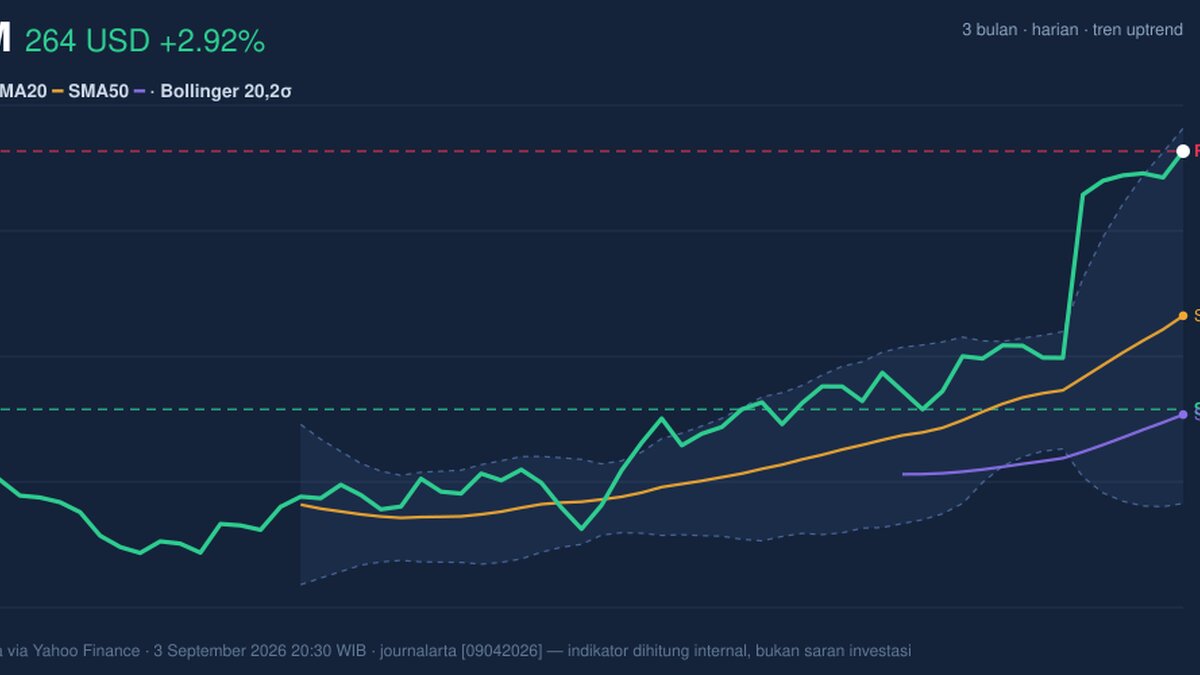
Salesforce (CRM) climbed to 264.43 USD on the NYSE, extending a sharp advance that has pushed the stock to the top of its recent trading range and close to its 3-month high of 268.27. The move is not just a one-day pop. It is the kind of price action that tells traders the market has re-rated the shares quickly, with momentum now doing most of the work while the risk of a pause or pullback has also risen.
Trend & Price Action
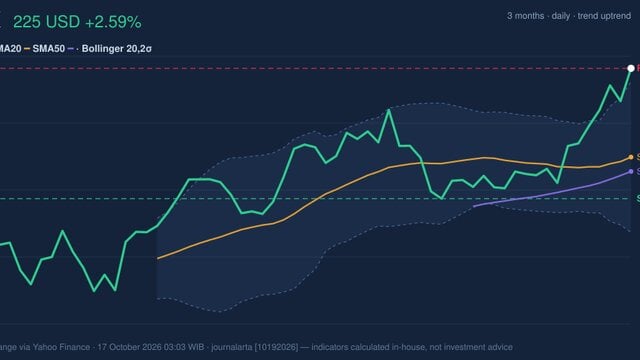
As shown in the chart, CRM is still in an uptrend, and the slope of SMA20 at 8.81% over 5 days shows the shorter-term trend is accelerating rather than flattening out. The stock is trading well above both the SMA20 at 217.59 and the SMA50 at 189.47, which matters because it means the market is pricing in stronger near-term sentiment than the longer average had implied. In plain language, the shares have moved far enough above their moving averages that the trend is clearly positive, but also stretched.
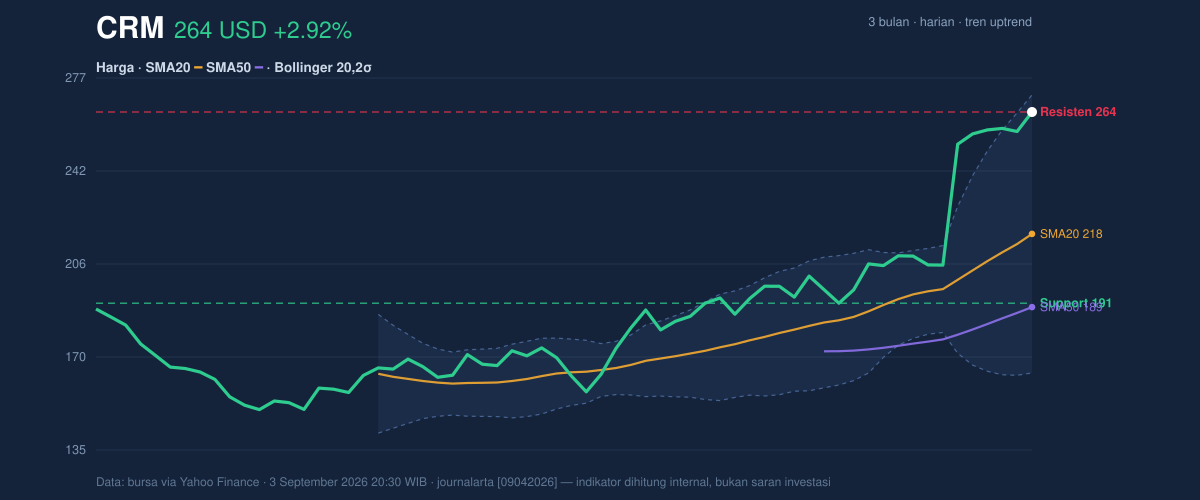
The absence of a new MA-cross is important. A crossover often marks a fresh trend shift, but here the message is different: the trend is already established, and the current question is whether it can keep extending without losing steam. The stock is also sitting at 100% of its 20-hour range, with support at 190.97 and resistance at 264.43. That means the market has spent the session pressing the upper boundary rather than exploring lower levels, a sign of strong buying pressure but also of limited immediate room unless the stock clears the next ceiling.
The broader range tells a similar story. The 3-month low of 146.32 is far below the current price, while the 3-month high of 268.27 sits just above it. That proximity to the high suggests the rally has already done much of its heavy lifting, and any further upside now depends on whether buyers can absorb profit-taking near the top of the range.
Oscillators & Momentum
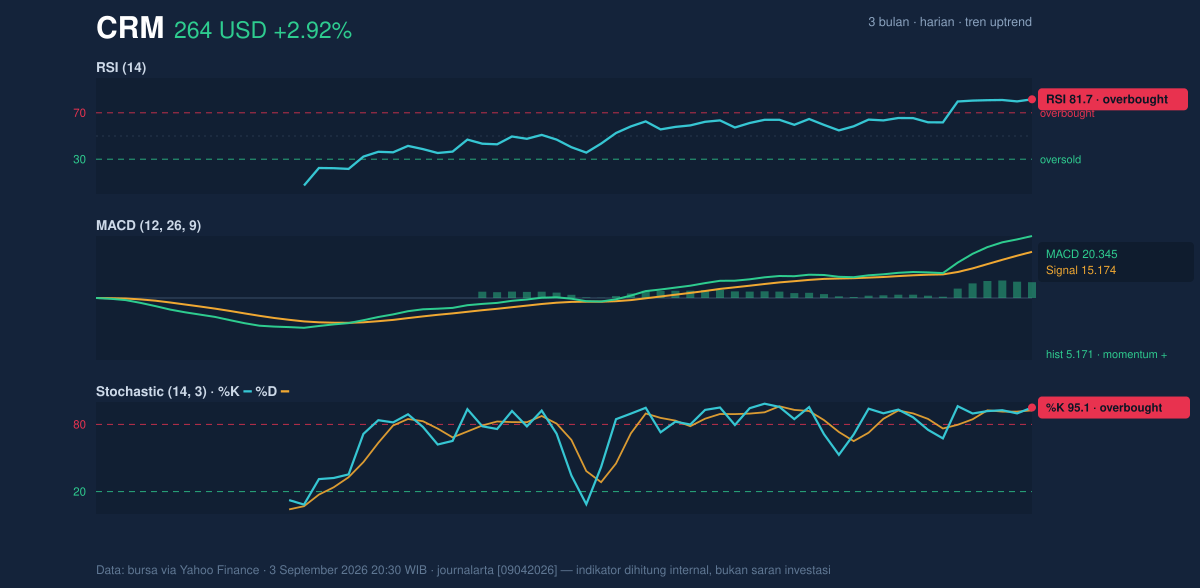
The momentum gauges are strong, but they are also flashing caution. RSI at 81.7 is firmly overbought, and Stochastic %K at 95.1 with %D at 92.5 is also overbought. For non-specialists, that does not mean the stock must fall immediately; it means the pace of buying has been intense enough that the market may be vulnerable to a cooling-off period. When both oscillators are this elevated, traders often watch for whether momentum can stay pinned high or whether the stock starts to drift sideways while the indicators reset.
That said, the MACD at 20.345 versus the signal line at 15.174, with a positive histogram of 5.171, shows trend momentum is still intact. MACD is a trend-following measure, so a positive gap like this means the recent price move remains stronger than the slower trend baseline. In other words, the stock is overextended, but not yet technically exhausted. The tension between the overbought oscillators and the positive MACD is the key signal in the chart: momentum is strong enough to keep the rally alive, yet stretched enough to make the next move less one-directional.
Volatility & Volume
The volatility picture reinforces that view. Bollinger Bands are widening, with a 49.1% band width, which signals a market that is moving aggressively rather than drifting. The %B at 94% shows the price is trading very near the upper band at 270.99. That positioning often reflects strong trend momentum, but it also means the stock is priced near the upper edge of what the recent volatility envelope has allowed. The ATR(14) at 11.44, or 4.3% of price, confirms that daily swings are large. For readers, ATR is simply a gauge of how much the stock tends to move in a day; a reading this high means stops and reversals can come quickly.
Volume adds a useful check. Last volume was 16,028,300, almost exactly in line with the 20-hour average of 16,477,375, or about 1.0× normal. That matters because a breakout backed by heavy turnover is usually more convincing than one driven by thin trading. Here, participation is steady rather than explosive, so the rally looks supported but not euphoric. The fact that OBV is rising still matters: on-balance volume tracks whether volume is flowing into the stock over time, and a rising line suggests accumulation has been persistent even if the latest session was not unusually busy.
Key Levels & Scenarios
As shown in the chart, the immediate technical map is tight. 264.43 is both the latest price and the current 20-hour resistance, while the next visible reference above is the 3-month high at 268.27. If CRM can move through that area, the chart would be signaling that buyers are willing to pay beyond the recent ceiling. If it cannot, the overbought RSI and Stochastic readings suggest the stock may need to digest gains before attempting another push.
The most important downside reference is 190.97, the 20-hour support. That level is far below the current price, which highlights how strongly the stock has outrun its short-term floor. The gap between price and support is a reminder that trend strength can cut both ways: it creates upside momentum, but it also leaves room for sharper air pockets if sentiment turns.
Technical Verdict: HOLD (wait & see)
Reasons:
- MACD is positive, showing trend momentum is still aligned with the advance.
- RSI at 81.7 and Stochastic at 95.1/92.5 are overbought, which argues for caution after a fast run.
- Bollinger Bands are wide and price is near the upper band, meaning volatility is elevated and the stock is stretched.
Verdict invalidated if price breaks below 190.97.
- Ideal Entry Range: 217.59 to 190.97
- Exit Target (Target Price): 268.27 to 270.99
- Stop Loss protection: below 190.97
In plain English, CRM is still strong, but the chart says the rally is already extended and deserves patience rather than urgency.
Latest hard fact: Salesforce closed the latest session at 264.43 USD, with RSI at 81.7 and Bollinger upper band at 270.99.
Summary Data CRM
| Last price | 264.43 USD |
| Change 1 day / 5 days / 1 month | 2.92% / 4.91% / 41.58% |
| Trend / MA-cross | uptrend / none |
| SMA20 / SMA50 | 217.59 / 189.47 |
| RSI (14) / Stochastic %K | 81.7 / 95.1 |
| Bollinger %B / ATR | 94% / 11.44 |
| Support / Resistance 20 days | 190.97 / 264.43 |
| Data as of | 3 September 2026 20:30 WIB |
Track CRM stock price daily: live levels, support/resistance and our full CRM analysis history.