DBS Testing Key Resistance: Stock Gains 1.35% (September 4, 2026)
On September 4, 2026: price 77.95 SGD, trend uptrend, RSI 63.6, support 73.55, resistance 77.60. technical analysis of dbs stock. DBS Testing Key Resistance —…
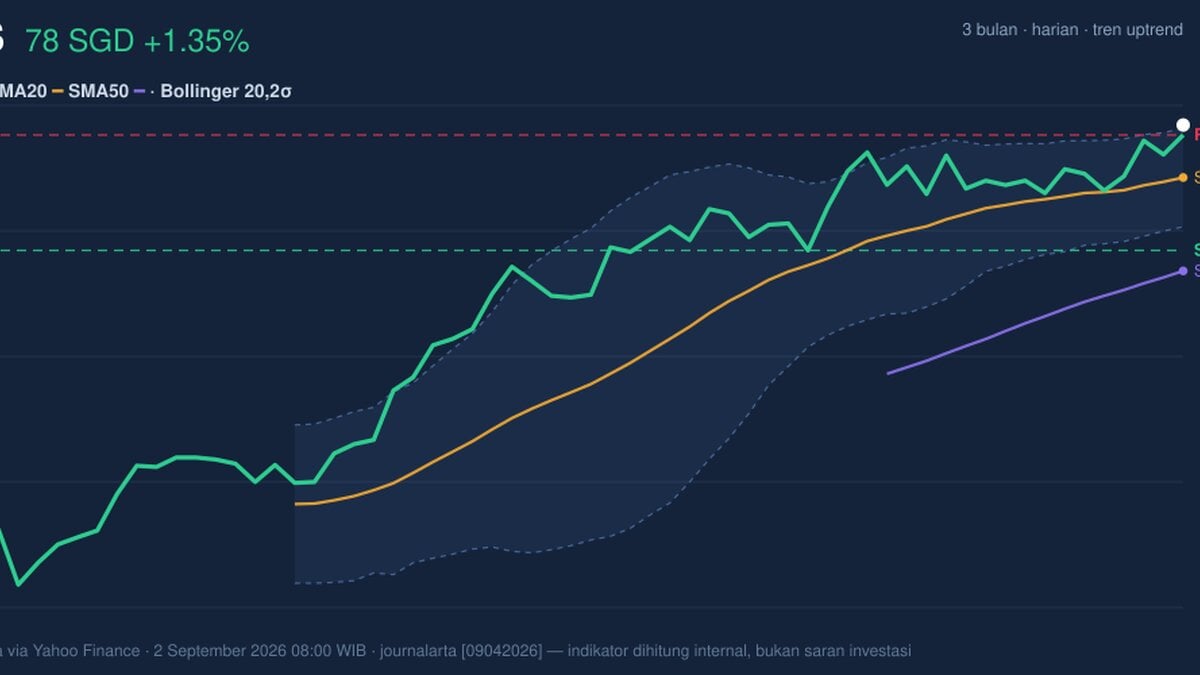
DBS Group’s shares were last quoted at 77.95 SGD on SGX, up 1.35% from the previous close, and now sit just above the upper Bollinger band as the stock presses against a near-term ceiling. That move matters because it shows buyers have kept control of the trend, but the tape is also flashing signs that the advance is getting stretched: momentum is still positive on price, yet the faster oscillators are already overbought and MACD has slipped into negative territory. In plain terms, DBS is still climbing, but the climb is no longer smooth.
Trend & Price Action
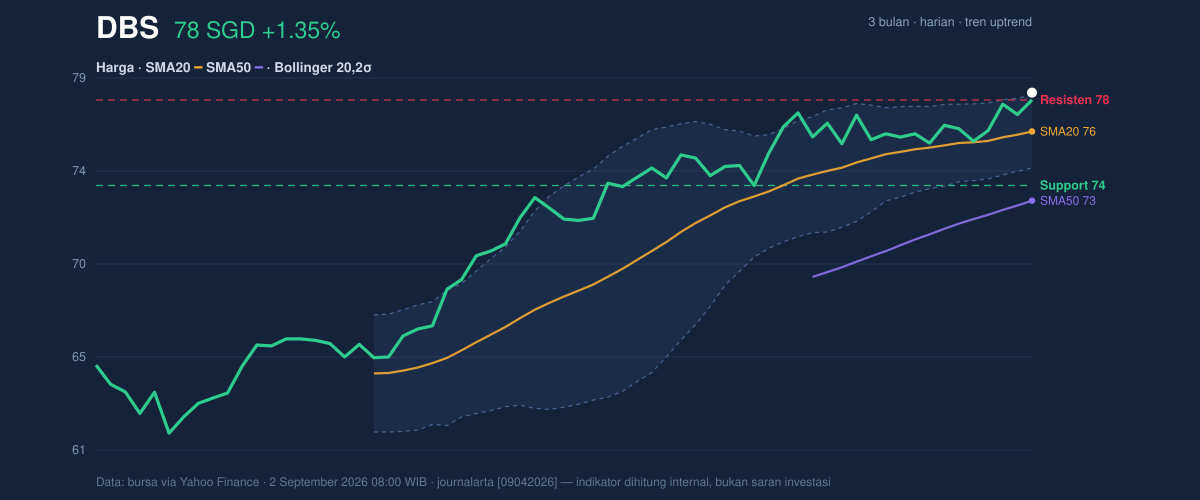
The broader structure remains constructive. DBS is trading above both the SMA20 at 76.11 and the SMA50 at 72.83, which tells traders the stock is above both its short- and medium-term trend markers. The uptrend is still intact, and the SMA20 slope of 0.72% over 5 days shows the short-term trend is rising rather than flattening out. There is no fresh MA-cross, so this is not a new trend signal; instead, it is a continuation pattern, where the market is trying to extend an existing move rather than launch a new one.
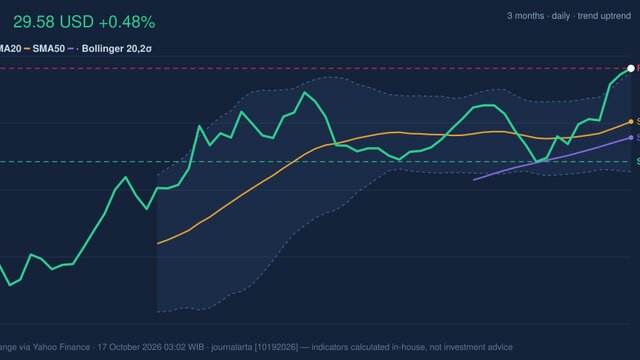
The position within the recent range is more revealing. DBS is at 109% of the 20-hour range, with 20-hour resistance at 77.60 and a 3-month high at 77.97. That means the stock is trading at the top end of its recent corridor and is now testing the area where supply has historically appeared. The fact that price is only a fraction below the 3-month high suggests strong demand, but also means the market is close to where traders often pause to lock in gains.
[ GRAFIK-HARGA ]
A short burst higher has brought DBS into a crowded zone.
Oscillators & Momentum
The momentum picture is mixed, and that is the key signal. The RSI at 63.6 is still neutral, which means the stock is not yet in a classic overbought condition by RSI standards. But the Stochastic %K at 93.5 and %D at 87.4 are both overbought, indicating price has risen faster than the market’s recent average pace. Stochastic tends to react quickly, so when it is this elevated, it often warns that the move may be mature even if the trend remains upward.
More concerning is the MACD at 1.096 versus the signal line at 1.192, with a histogram of -0.096. That negative histogram means upside momentum has weakened relative to the trigger line. In practical terms, the trend is still up, but the engine is no longer accelerating; it is starting to lose thrust. When MACD softens while Stochastic is overbought, it often signals that the market may need either a pause or a shallow pullback before another attempt higher.
[ GRAFIK-MOMENTUM ]
The message from momentum is simple: price is strong, but the pace is tiring.
Volatility & Volume
Volatility is subdued for now. The ATR(14) at 1.08, equal to 1.4% of price, points to low volatility. That usually means daily moves are relatively contained, but it can also precede a sharper break if the market exits the current compression. The Bollinger Bands add an important layer: the upper band is 77.84, the middle band is 76.11, and the lower band is 74.38. With %B at 103%, DBS is trading slightly beyond the upper band, which often reflects strength — but also tells us price has outrun its statistical envelope in the short term.
The 4.5% Bollinger width is narrowing, a classic squeeze setup. Squeezes do not predict direction, but they do warn that a larger move may be brewing once price escapes the band structure. The question is whether that move becomes a continuation or a reversal.
Volume is not yet confirming a decisive breakout. Last volume was 3,161,700, below the 20-day average of 4,446,492, or about 0.7x normal. That means the latest push higher was not backed by full participation. Still, OBV is rising, which suggests underlying accumulation has been present over time. The combination is important: the price is pushing up, but the market has not yet shown the kind of heavy turnover that would usually validate a forceful breakout above resistance.
Key Levels & Scenarios
The immediate map is clear. Support sits at 73.55, while resistance is 77.60. Price is now above resistance, but only marginally, and the proximity to the 3-month high of 77.97 makes this a sensitive zone. If DBS can hold above the 77.60 area, the chart would be confirming that the breakout is real rather than a brief overshoot. If it fails to hold, the market may revert toward the SMA20 at 76.11, where trend followers often reassess whether the move still has legs.
The broader implication of the squeeze is that DBS may be setting up for a larger directional move, but the current evidence does not yet show strong conviction from volume or momentum. That is why the next few sessions matter more than the last few points.
Technical Verdict: HOLD (wait & see)
HOLD (wait & see) because the trend is still upward, but momentum and participation are not fully confirming the latest push.
- Reason 1: Trend support remains positive — price is above the SMA20 and SMA50, and the SMA20 slope is rising.
- Reason 2: Momentum is stretched but weakening — Stochastic is overbought and MACD histogram is negative, which argues for caution near resistance.
- Reason 3: Volume is below average — the move has not yet been backed by strong turnover, even though OBV is rising.
- Verdict invalidated if price falls below 73.55, which would break the stated support and weaken the current uptrend structure.
- Ideal Entry Range: 76.11 to 77.60
- Exit Target: 77.97
- Stop Loss protection: below 73.55
For non-traders: DBS is still trending higher, but it is close to resistance and showing enough fatigue that the next move needs confirmation, not assumption.
“We’re right at the edge of the range now, and the market has to prove it can hold there.”
Summary Data DBS
| Last price | 77.95 SGD |
| Change 1 day / 5 days / 1 month | 1.35% / 2.24% / 4.63% |
| Trend / MA-cross | uptrend / none |
| SMA20 / SMA50 | 76.11 / 72.83 |
| RSI (14) / Stochastic %K | 63.6 / 93.5 |
| Bollinger %B / ATR | 103% / 1.08 |
| Support / Resistance 20 days | 73.55 / 77.60 |
| Data as of | 2 September 2026 08:00 WIB |
Track DBS share price daily: live levels, support/resistance and our full DBS analysis history.