MSFT Testing Key Resistance: Stock Gains 2.68% (September 4, 2026)
On September 4, 2026: price 510.12 USD, trend uptrend, RSI 65.7, support 480.35, resistance 513.53. technical analysis of msft stock. MSFT Testing Key…
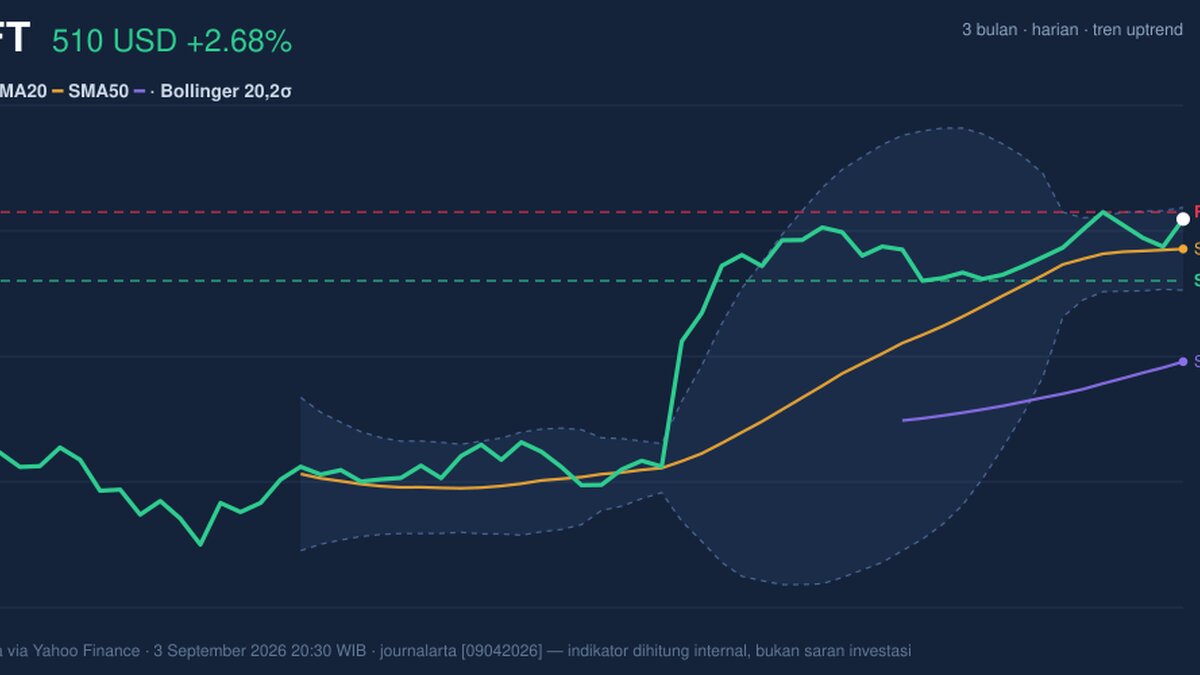
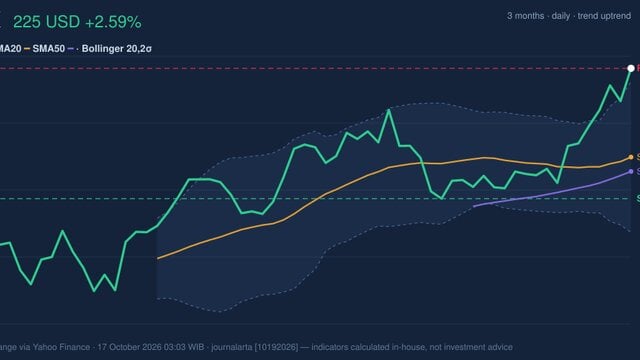
Microsoft rose on NASDAQ after the latest session in New York, with MSFT last at 510.12 USD, up from a previous close of 496.82. The move keeps the stock in a firm upward pattern, but the chart now shows a market that is stretching toward resistance rather than building a fresh base.
Trend & Price Action
The first signal is simple: price is above the 20-day average at 495.72 and far above the 50-day average at 441.23. That matters because it shows Microsoft is still trading in a well-established uptrend, not merely bouncing inside a weak range. The slope of the 20-day average is positive at 0.98% over 5 days, which suggests the trend is still rising rather than flattening out.
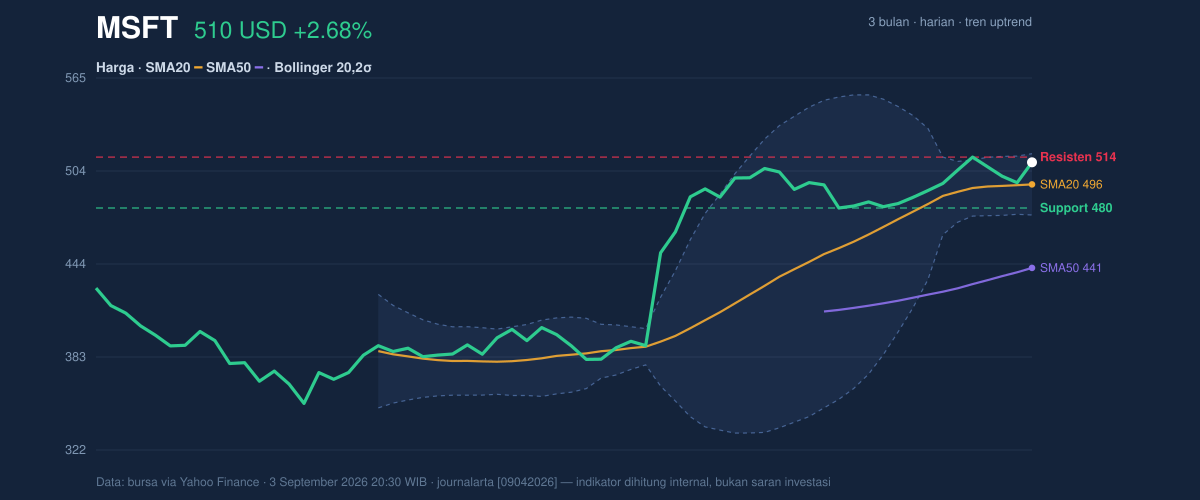
The stock is also sitting near the top of its recent band. With support at 480.35 and resistance at 513.53, the latest print places MSFT in the upper part of that corridor, around 90% of the range. In plain terms, the market has already done much of the upward work for now, so new buyers are paying up close to the ceiling. That does not break the trend, but it does mean the stock is more exposed to pause or consolidation if momentum cools.
The Bollinger Bands reinforce that message. The upper band is at 515.71, with the middle band at 495.72 and the lower band at 475.73. Because price is near the top of the band and %B is 86%, Microsoft is trading close to the upper edge of its recent volatility envelope. That usually signals strength, but also tells readers the stock is no longer cheap within its own short-term range. The band width of 8.1% is normal, so this is not a compression setup waiting to explode; it is a steady trend with moderate room for swings.
Microsoft is also only a few points below its 3-month high of 517.78, which is important because markets often hesitate near prior peaks. A clean move through that zone would show the stock can absorb supply from investors who may have been waiting to sell into strength.
Oscillators & Momentum
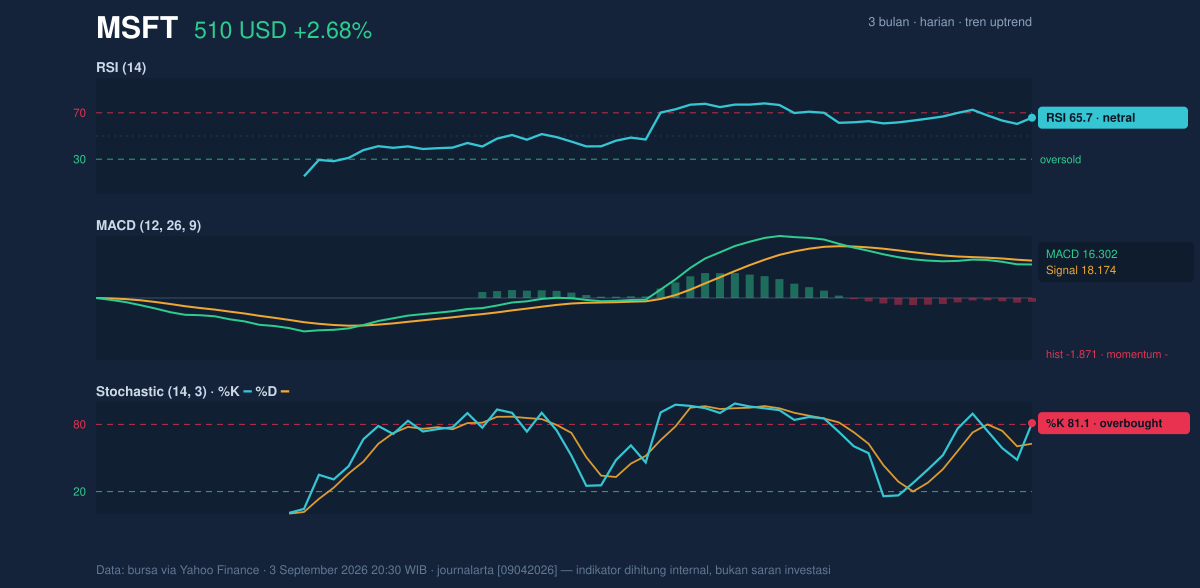
The momentum picture is more mixed than the trend picture. RSI at 65.7 is still technically in the neutral zone, but it is leaning toward the upper end of that band. That tells us the stock has room left before it becomes fully extended, yet it is already closer to “hot” than “cool.”
The stronger warning comes from the Stochastic reading of 81.1 / 62.8. Stochastic measures where price sits within its recent range, and a reading above 80 is commonly treated as overbought. That does not automatically mean a reversal is coming, but it does mean the stock has been closing near the top of the range often enough to attract caution. In other words, the rally is still intact, but it is no longer moving from a position of comfort.
The clearest short-term drag is the MACD. MACD at 16.302 remains positive in absolute terms, but it sits below the signal line at 18.174, leaving a -1.871 histogram. That negative histogram means upward momentum has slowed even while the price trend remains positive. This is a classic divergence-style message: the stock can still rise, but the internal push behind the move is weaker than the price action alone suggests. For readers, that usually translates into a need for patience rather than urgency.
Volatility & Volume
Microsoft’s ATR of 10.48, equal to 2.1% of price, points to moderate day-to-day movement. That is important because it suggests the stock is not behaving like a highly erratic name; instead, it is moving in a controlled way. In practical terms, a moderate ATR can allow trends to continue without dramatic gaps, but it also means any break above resistance may need a real push, not just a quiet drift.
Volume provides a useful confirmation. The latest volume of 24,111,400 was just above the 20-session average of 23,534,260, or about 1.0x normal. That is enough to say the move was not empty, but it was not a decisive surge either. The better signal is that OBV is rising, which means volume has generally been supporting the broader advance over time. Rising OBV often suggests money is flowing in during upswings, even if a single day’s turnover is only average.
The combination of normal volume and rising OBV tells a nuanced story: the trend still has participation behind it, but the latest advance is not showing the kind of aggressive buying that often accompanies a breakout attempt.
Key Levels & Scenarios
The market is now focused on a narrow zone between 513.53 resistance and the 515.71 upper Bollinger Band. That is the immediate test. If Microsoft clears that area, the chart would be signaling that the stock is not just trending upward, but also absorbing supply near its recent high of 517.78. If it fails there, the likely response is a retreat toward the middle band at 495.72, where the trend would be re-tested rather than broken.
On the downside, 480.35 support is the level that keeps the current structure intact. A move below that area would weaken the near-term pattern and suggest the rally is losing traction. Because the stock is still above both moving averages, a pullback to the 20-day average would not be unusual; what matters is whether buyers defend it.
Technical Verdict: HOLD (wait & see)
HOLD (wait & see)
- Price trend remains constructive: MSFT is above the 20-day SMA at 495.72 and well above the 50-day SMA at 441.23, which keeps the broader structure bullish.
- Momentum is less supportive than price: Stochastic is overbought at 81.1 and MACD histogram is negative at -1.871, showing the rally is extended and internal momentum has cooled.
- Resistance is close: price is near 513.53 resistance and the 515.71 upper Bollinger Band, so upside progress may need fresh buying to continue.
- Verdict invalidated if price falls below 480.35, which would damage the current short-term support structure.
- Ideal entry range: 495.72 to 480.35
- Exit target: 513.53 to 517.78
- Stop loss protection: below 475.73
In plain English: Microsoft still looks strong, but the chart says the stock is close to a ceiling and the next move needs proof before the trend can be trusted again.
“The stock is still climbing, but the engine is no longer running at full power.”
Summary Data MSFT
| Last price | 510.12 USD |
| Change 1 day / 5 days / 1 month | 2.68% / 1.00% / 2.05% |
| Trend / MA-cross | uptrend / none |
| SMA20 / SMA50 | 495.72 / 441.23 |
| RSI (14) / Stochastic %K | 65.7 / 81.1 |
| Bollinger %B / ATR | 86% / 10.48 |
| Support / Resistance 20 days | 480.35 / 513.53 |
| Data as of | 3 September 2026 20:30 WIB |
Track MSFT stock price daily: live levels, support/resistance and our full MSFT analysis history.