NVDA Testing Key Resistance: Stock Gains 1.80% (September 4, 2026)
On September 4, 2026: price 228.45 USD, trend uptrend, RSI 59.0, support 208.48, resistance 228.45. technical analysis of nvda stock. NVDA Testing Key…
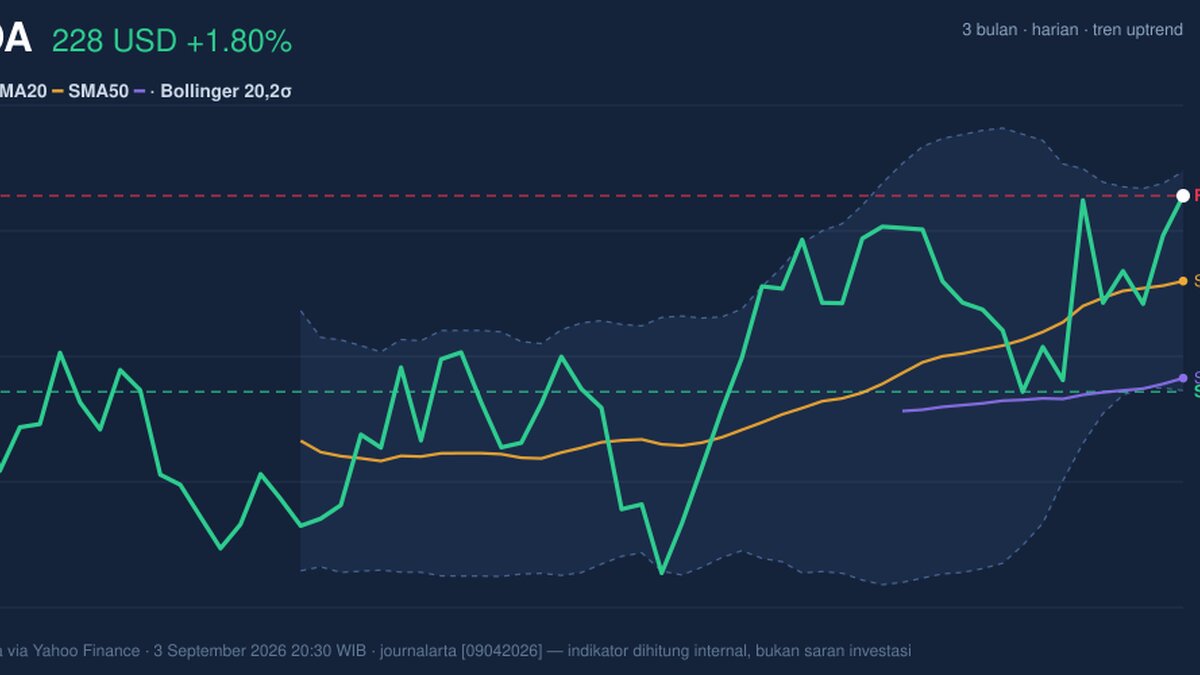
Nvidia Corp. rose on the NASDAQ to 228.45 USD on 3 September 2026, a move that put the stock back near the top of its recent trading range. It was a firm session. The advance came with the shares still holding above key trend markers, but the chart also shows the stock pressing into overhead resistance as momentum becomes stretched.
Trend & Price Action
As shown in the chart, Nvidia remains in an uptrend, with the price trading above the SMA20 at 219.76 and the SMA50 at 209.87. That matters because when a stock stays above both short- and medium-term averages, it usually signals that buyers have kept control of the trend rather than merely producing a one-day bounce. The SMA20 slope of 1.18% over 5 days confirms that the near-term trend is still rising, not flattening out.
The stock’s position is also important. At 228.45, Nvidia is sitting at the 100% end of its 20-hour range, with 20-hour resistance at 228.45 and the 3-month high at 230.47. In plain language, the shares are now trading right under a ceiling that has not yet been broken. That often means the next move depends less on direction and more on whether buyers have enough force to push through that ceiling or whether the stock pauses and consolidates first.
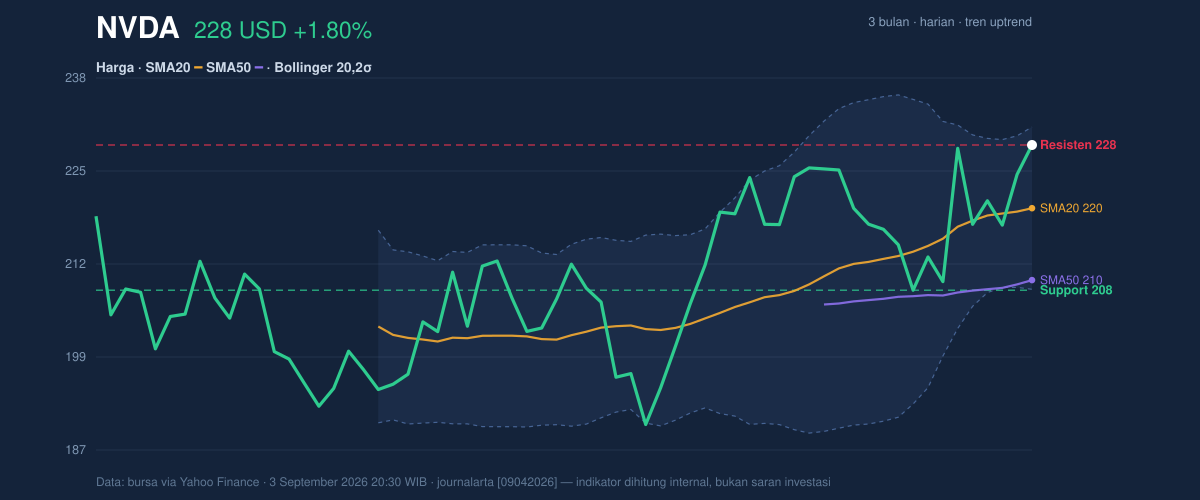
The Bollinger bands, which frame normal price movement around the average, show the stock near the upper edge of its recent band structure. With the upper band at 230.92, %B at 89%, and the band width at 10.2%, Nvidia is trading close to the top of its statistical range, but not in an unusually wide or panic-driven setup. That combination suggests strength, yet also tells readers the shares are extended enough that fresh upside may need a catalyst rather than simple drift.
Oscillators & Momentum
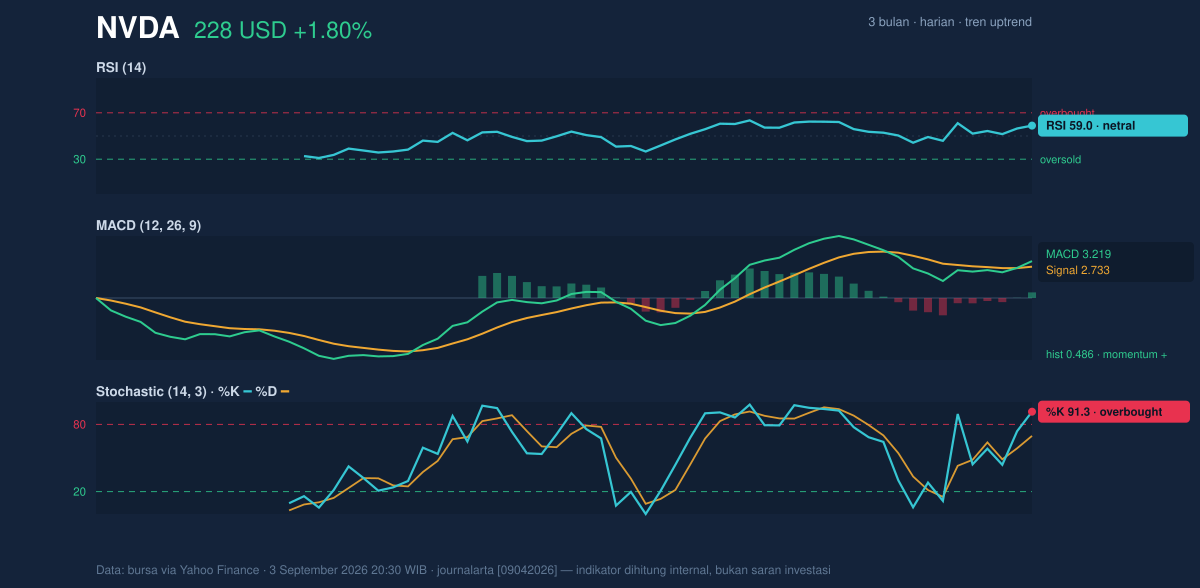
The momentum picture is more mixed than the trend picture. The RSI at 59.0 is still neutral, which means the stock is not yet in a classic overbought reading by that measure. But the Stochastic %K at 91.3 versus %D at 69.7 is overbought, and that is a more immediate warning that recent gains have run ahead of short-term cooling. In practical terms, Stochastic is saying the stock has climbed quickly enough that some traders may already be locking in gains.
The MACD at 3.219, above its signal line at 2.733 with a histogram of 0.486, still points to positive momentum. MACD is a trend-following gauge, so its positive reading means the broader move remains constructive even if the shorter-term oscillator is stretched. That is the key tension in the chart: the trend is intact, but the stock is no longer cheap in momentum terms.
Volatility & Volume
Volatility is moderate rather than explosive. The ATR at 7.39, or 3.2% of price, suggests Nvidia can still move materially in a single session, but the market is not showing a disorderly spike in daily range. The Bollinger band width of 10.2% is also described as normal, which implies the stock is not in a compression phase that typically precedes a dramatic expansion. Instead, it is moving within a fairly standard volatility envelope while testing the upper end of that envelope.
Volume adds a layer of confirmation. Last volume was 133,994,100, above the 20-day average of 127,401,575, or about 1.1× normal. That matters because price advances on thin volume can be fragile, while price advances on above-average participation usually carry more credibility. The OBV is rising, which means volume has generally been supporting the up move rather than diverging from it. In other words, investors are still showing up for the stock, even if the momentum gauges say the move is getting stretched.
Key Levels & Scenarios
The nearest support from the 20-hour structure sits at 208.48, while the immediate resistance is the current price itself at 228.45. Above that, the next obvious reference is the 3-month high at 230.47, with the Bollinger upper band at 230.92 acting as a nearby technical cap. These levels matter because they define the market’s current tug-of-war: buyers have preserved the trend, but sellers still have a visible defense zone just overhead.
If Nvidia can clear the 230.47 area and hold above it, the chart would indicate that the stock has absorbed the recent overbought pressure and is moving into fresh territory. If it fails there, the more likely interpretation is a pause or pullback toward the middle of the Bollinger structure at 219.76, which is also the SMA20. A deeper loss of trend confidence would only emerge if price slips toward the 208.48 support and the lower Bollinger band at 208.60, where the chart would be testing whether the recent uptrend still has enough structure beneath it.
Technical Verdict: HOLD (wait & see)
HOLD (wait & see)
- The uptrend remains intact because price is above the SMA20 and SMA50, and the MACD is still positive.
- The Stochastic is overbought, while price is pressing against resistance at 228.45 and the 3-month high at 230.47, which raises the odds of near-term cooling.
- Volume is supportive at 1.1× normal, but the stock is already near the upper Bollinger band at 230.92, limiting clean upside confirmation right now.
- Verdict invalidated if price falls below 208.48.
- Ideal Entry Range: 219.76 to 228.45
- Exit Target: 230.47 to 230.92
- Stop Loss protection: 208.48
For non-traders, this means Nvidia still looks technically healthy, but the stock is close enough to resistance that the chart is asking for confirmation rather than enthusiasm.
The 3-month high stands at 230.47.
Summary Data NVDA
| Last price | 228.45 USD |
| Change 1 day / 5 days / 1 month | 1.80% / 0.21% / 4.32% |
| Trend / MA-cross | uptrend / none |
| SMA20 / SMA50 | 219.76 / 209.87 |
| RSI (14) / Stochastic %K | 59.0 / 91.3 |
| Bollinger %B / ATR | 89% / 7.39 |
| Support / Resistance 20 days | 208.48 / 228.45 |
| Data as of | 3 September 2026 20:30 WIB |
Track NVDA stock price daily: live levels, support/resistance and our full NVDA analysis history.