OCBC Testing Key Resistance: Stock Gains 1.85% (September 4, 2026)
On September 4, 2026: price 31.92 SGD, trend uptrend, RSI 66.5, support 28.63, resistance 31.85. technical analysis of ocbc stock. OCBC Testing Key Resistance…
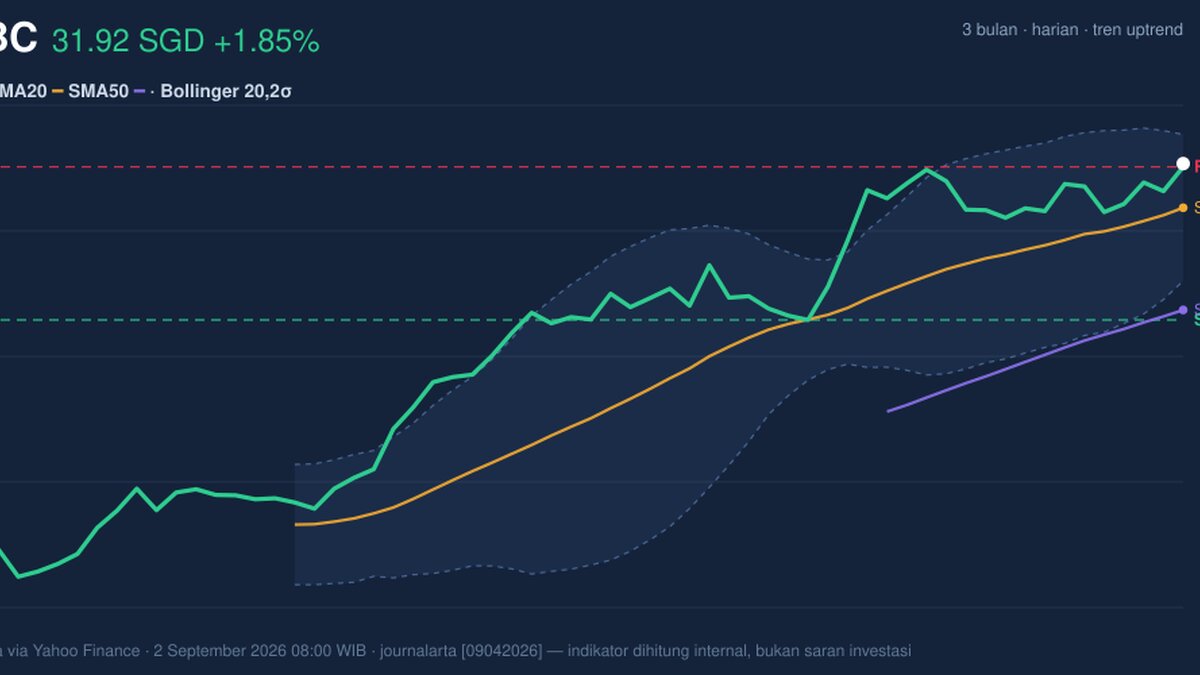
OCBC Bank’s shares rose to SGD 31.92 on SGX, up 1.85% from the previous close, and the move leaves the stock pressing against the upper end of its recent trading band, as shown in the chart. The price is now above both the SMA20 at 30.99 and the SMA50 at 28.84, which keeps the broader structure pointed upward, but momentum gauges are no longer moving in lockstep. That split matters: the trend is still constructive, yet short-term conditions are getting stretched.
Trend & Price Action
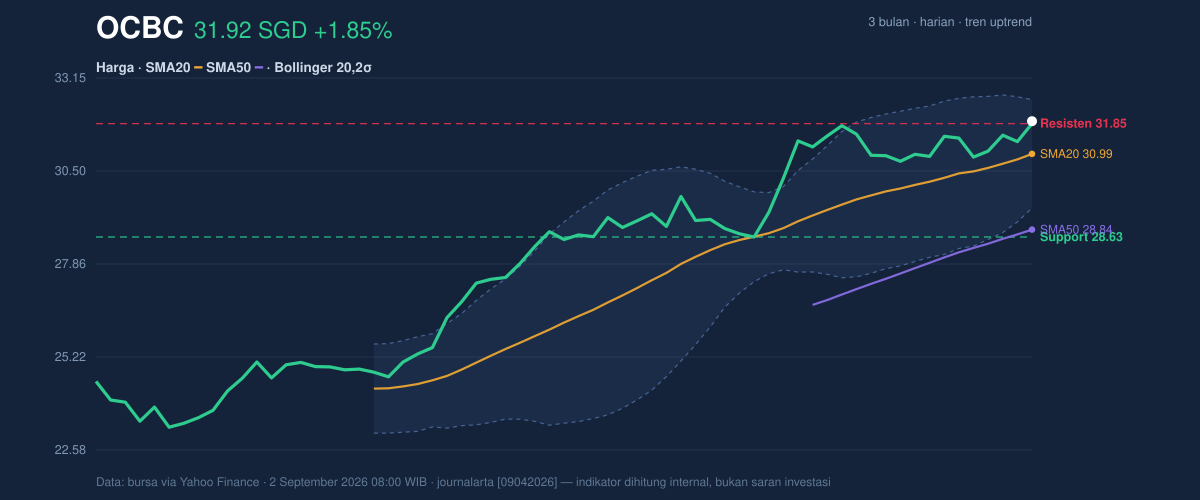
The most important signal in the price structure is that OCBC remains in an uptrend, with the SMA20 slope at 1.82% over 5 days. A rising short-term average tells you buyers have been willing to pay progressively higher prices, not just react to one-off news. The stock is also trading well above the SMA50, so the medium-term base is still supportive rather than corrective.
But the latest close also sits just above the 20-hour resistance at 31.85 and near the 3-month high of 31.86. That is a subtle but important signal. When a stock trades right at a recent ceiling, the market is testing whether demand is strong enough to force a fresh breakout, or whether traders will take profits and cap the move. The fact that price is at 102% of its 20-hour range suggests there is little room left in the immediate band unless the stock can extend beyond that high.
The Bollinger setup reinforces that reading. Price is near the upper band at 32.53, with the middle band at 30.99 and the lower band at 29.45. In plain language, the stock is trading in the upper part of its normal volatility envelope. The %B at 80% shows price is closer to the top of that envelope than the middle, which is consistent with strength, but also with a market that may be temporarily overextended.
Oscillators & Momentum
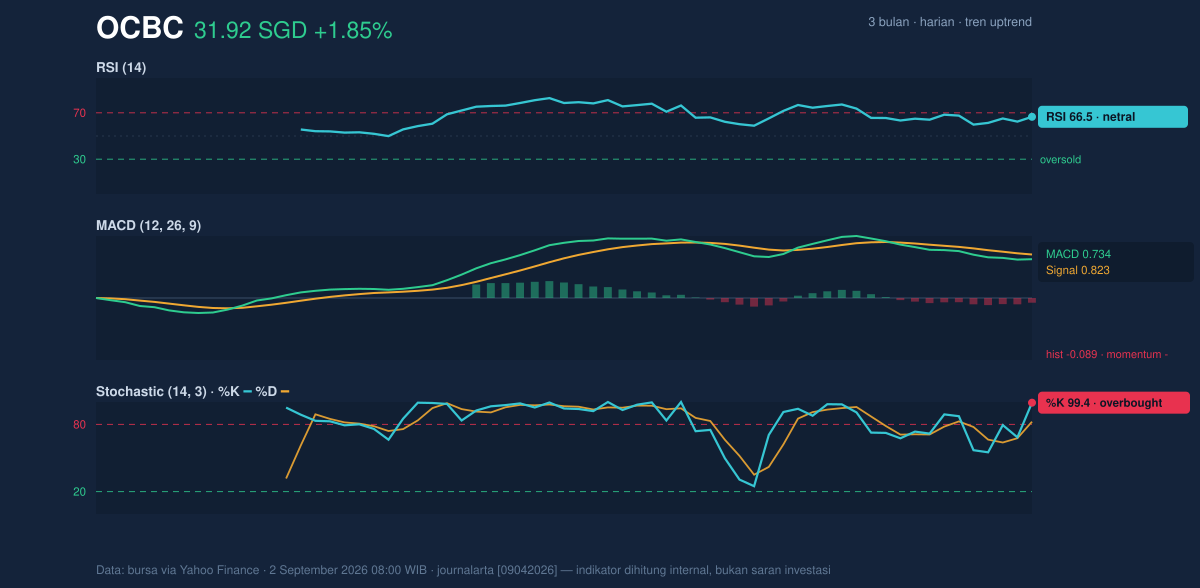
The momentum picture is more mixed than the trend picture. The RSI at 66.5 is still technically in a neutral zone, but it is close to the level where traders start to worry about overheating. The Stochastic %K at 99.4 and %D at 82.4 are much more aggressive: that is an overbought reading, meaning the stock has risen fast enough that short-term enthusiasm may have become crowded.
The MACD at 0.734 remains above zero, which keeps the broader momentum positive, but the signal line at 0.823 is higher and the histogram at -0.089 shows momentum is turning negative in the near term. That combination is often what a late-stage advance looks like: the trend is still up, but the pace of gains is slowing before the market decides whether to continue or pause. In other words, the stock has not broken down, but it is no longer accelerating.
Volatility & Volume
The ATR(14) at 0.56, or 1.8% of price, points to moderate volatility. That matters because a stock can be technically strong and still be relatively calm; here, the range is active enough to allow movement, but not so wide that the chart is in panic mode. The Bollinger band width of 9.9% is described as normal, so this is not a volatility squeeze that usually precedes a sharp expansion. Instead, the market appears to be digesting gains within a fairly standard band.
Volume offers one caution. Last volume was 5,788,800, below the 20-day average of 6,732,691, or about 0.9x normal. A breakout attempt backed by lighter-than-average participation is less convincing than one driven by a surge in turnover. At the same time, OBV is rising, which means cumulative volume flow is still leaning in the direction of the advance. That is a useful confirmation: even if the latest session was not especially busy, the broader flow of shares has not turned against the stock.
Key Levels & Scenarios
The nearest level to watch is the 31.85 resistance, which is effectively being tested now. If the stock can hold above that area, the next reference point is the upper Bollinger band at 32.53, where price would be challenging the top of its normal range. If it fails to stay above 31.85, the chart points back toward the SMA20 at 30.99, which also sits at the Bollinger middle band and acts as the first line of trend support.
Below that, the more important support sits at 28.63. That level is the lower end of the 20-hour range and would likely matter if the recent advance loses traction. The SMA50 at 28.84 sits close by, so the medium-term moving average and the range support are reinforcing one another. That clustering usually makes the zone more meaningful than a single line on its own.
Technical Verdict: HOLD (wait & see)
HOLD (wait & see)
- RSI at 66.5 keeps the stock firm, but Stochastic at 99.4/82.4 shows the short-term move is overbought.
- MACD histogram at -0.089 signals fading momentum even though the broader trend remains up.
- Price is testing 31.85 resistance and sits near the 3-month high of 31.86, so confirmation is needed before the move can be treated as sustained.
Verdict invalidated if price falls below 28.63.
- Ideal Entry Range: 30.99 to 31.85
- Exit Target: 32.53
- Stop Loss protection: 28.63
For non-traders, this means OCBC still looks healthy, but the latest climb is close enough to resistance that the market is waiting for proof the move can continue.
The next chart watchpoint is whether OCBC can close decisively above 31.85 after the latest test of its 3-month high at 31.86.
Summary Data OCBC
| Last price | 31.92 SGD |
| Change 1 day / 5 days / 1 month | 1.85% / 1.53% / 11.14% |
| Trend / MA-cross | uptrend / none |
| SMA20 / SMA50 | 30.99 / 28.84 |
| RSI (14) / Stochastic %K | 66.5 / 99.4 |
| Bollinger %B / ATR | 80% / 0.56 |
| Support / Resistance 20 days | 28.63 / 31.85 |
| Data as of | 2 September 2026 08:00 WIB |
Track OCBC share price daily: live levels, support/resistance and our full OCBC analysis history.