Singtel Stock Drops 0.45%, Death Cross Pressure In Focus
On September 4, 2026: price 4.44 SGD, trend sideways, RSI 51.8, support 4.25, resistance 4.54. technical analysis of singtel stock. Singtel Stock Drops — full…
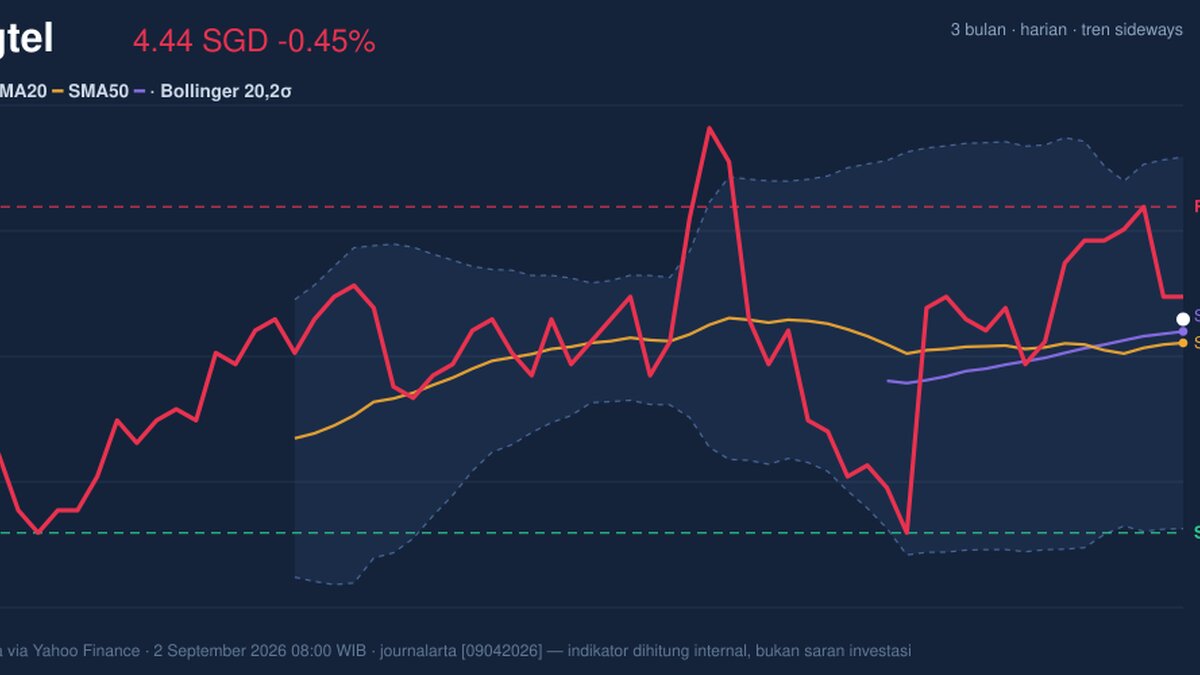
Singapore Telecom (Singtel) edged down to SGD 4.44 on SGX in Singapore, slipping 0.45% from the previous close as the stock stayed inside a narrow trading band, according to Yahoo Finance data for 2 September 2026, 08:00 WIB. The move matters less for its size than for what it says about positioning: the shares are still holding above short-term trend support, but they are also not yet strong enough to shake off the death cross signalled by the moving averages, a pattern that usually tells traders the shorter trend has weakened relative to the longer one.
Trend & Price Action
The chart shows Singtel trading just above its SMA20 at 4.42 and marginally above its SMA50 at 4.43, which keeps the price in a technically balanced zone rather than a clear downtrend or uptrend. That small premium is important. It means the market is still willing to pay slightly more than the recent average, but only by a thin margin, so the stock is hovering near the point where support and hesitation meet.
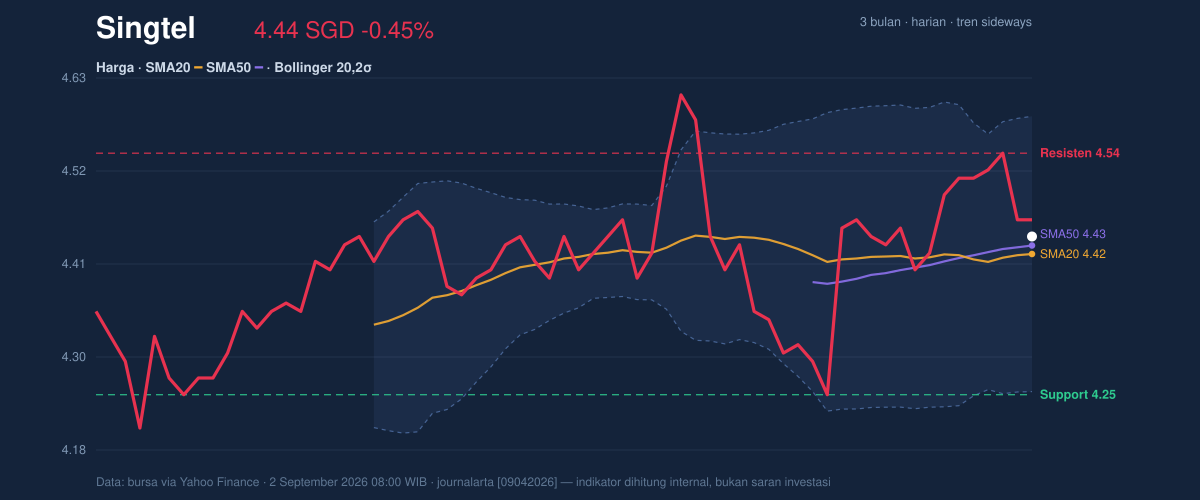
The broader structure is still described as sideways, and that fits the tape: the price is sitting around the middle of its recent range, with the 20-hour support at 4.25 and 20-hour resistance at 4.54. Being at roughly 66% of the range suggests buyers have recently done enough to lift the stock off the lower half, but not enough to force a decisive test of the upper boundary. The 3-month high of 4.70 and 3-month low of 4.15 frame the current action as recovery without conviction. In plain terms, the market has moved away from the weakest levels, but it has not yet proven it can reclaim the upper part of the range.
Oscillators & Momentum
Momentum is not weak, but it is not enthusiastic either. The RSI at 51.8 is neutral, which means the stock is neither overbought nor oversold; it is simply balanced. That matters because a neutral RSI often reflects a market waiting for a catalyst rather than one already committed to a direction.
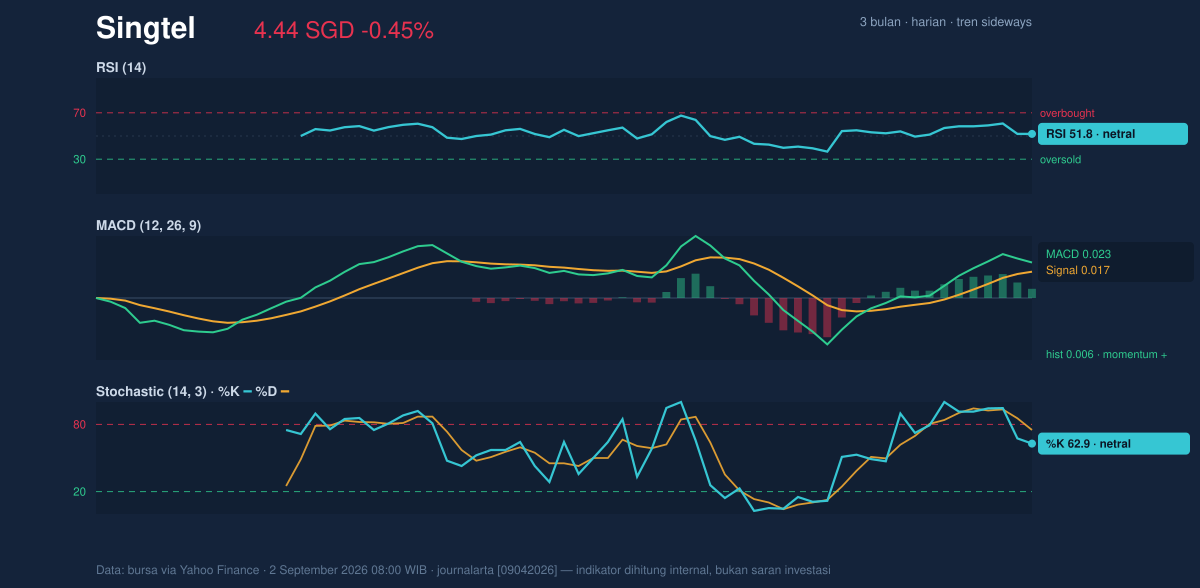
The Stochastic reading of 62.9 / 75.0 is also neutral, though it is closer to the upper half of its band, which can hint that near-term upside has room to continue but may need fresh buying to do so. More interesting is the MACD at 0.023 versus signal at 0.017, with a positive histogram of 0.006. MACD is a trend-following tool, and when it sits above its signal line it suggests momentum has turned modestly positive. In other words, the stock is not accelerating sharply, but the internal push is still leaning upward even while the moving-average structure remains cautious.
Volatility & Volume
The Bollinger Bands add another layer to the picture. With the upper band at 4.58, middle band at 4.42, and lower band at 4.25, the price at 4.44 is sitting just above the midline, which is usually a sign of equilibrium rather than stress. The %B at 56% reinforces that view: the stock is above the midpoint of the band system, but not near the top, so it is neither stretched nor washed out.
The more notable signal is the 7.5% band width, which indicates a squeeze. A squeeze means volatility has tightened, often before a sharper move in either direction. That does not predict the direction, but it does suggest the current quiet may not last. The ATR of 0.08, or 1.8% of price, says day-to-day movement remains moderate rather than explosive.
Volume, however, is the caution flag. The latest turnover of 14,773,200 was only 0.6× the 20-hour average of 26,378,954, so the move is happening on quieter participation. That usually weakens the reliability of any breakout attempt, because a price move without broad trading support can fade quickly. Still, OBV is rising, which suggests accumulation is building beneath the surface even if the latest session was not heavily traded. That combination — light volume on the day, but improving OBV — often means buyers are present, just not yet forceful enough to dominate the tape.
Key Levels & Scenarios
The immediate technical map is straightforward. 4.25 is the key floor, because it aligns with both the lower Bollinger Band and the 20-hour support. A failure there would expose the lower part of the recent range and raise the risk that the stock revisits the 3-month low of 4.15. On the upside, 4.54 is the first hurdle, and a move through it would open the way toward the 4.58 Bollinger upper band and then the 3-month high of 4.70.
The significance of these levels is not just numerical. A hold above 4.42–4.43 keeps the stock above its short averages and preserves the idea that the recent drift is consolidation rather than deterioration. A clean push above 4.54, especially if accompanied by stronger volume, would tell traders that the squeeze is resolving upward. If price slips back under 4.25, the current balance would likely tilt in favour of sellers.
Technical Verdict: HOLD (wait & see)
HOLD (wait & see) fits best because the indicators are mixed: MACD is positive, RSI is neutral, and price is still above SMA20 and SMA50, but the chart also shows a death cross and volume is only 0.6× average. The Bollinger squeeze suggests a larger move could be coming, yet the direction is not confirmed. The verdict is invalidated if price falls below 4.25, because that would break the nearest support and the lower Bollinger boundary.
- Ideal Entry Range: 4.25 to 4.43
- Exit Target: 4.54 to 4.58
- Stop Loss protection: below 4.25
In plain English, Singtel is not signaling a clear breakout or breakdown yet, but the next move is likely to matter more than the last one.
Yahoo Finance data show the 3-month high at 4.70.
Summary Data Singtel
| Last price | 4.44 SGD |
| Change 1 day / 5 days / 1 month | -0.45% / -1.55% / 0.23% |
| Trend / MA-cross | sideways / death |
| SMA20 / SMA50 | 4.42 / 4.43 |
| RSI (14) / Stochastic %K | 51.8 / 62.9 |
| Bollinger %B / ATR | 56% / 0.08 |
| Support / Resistance 20 days | 4.25 / 4.54 |
| Data as of | 2 September 2026 08:00 WIB |
Track Singtel share price daily: live levels, support/resistance and our full Singtel analysis history.