Tencent Stock Technicals Today: Drops 1.19%, Death Cross Pressure
On September 4, 2026: price 433.00 HKD, trend downtrend, RSI 39.5, support 433.00, resistance 481.40. technical analysis of tencent stock.
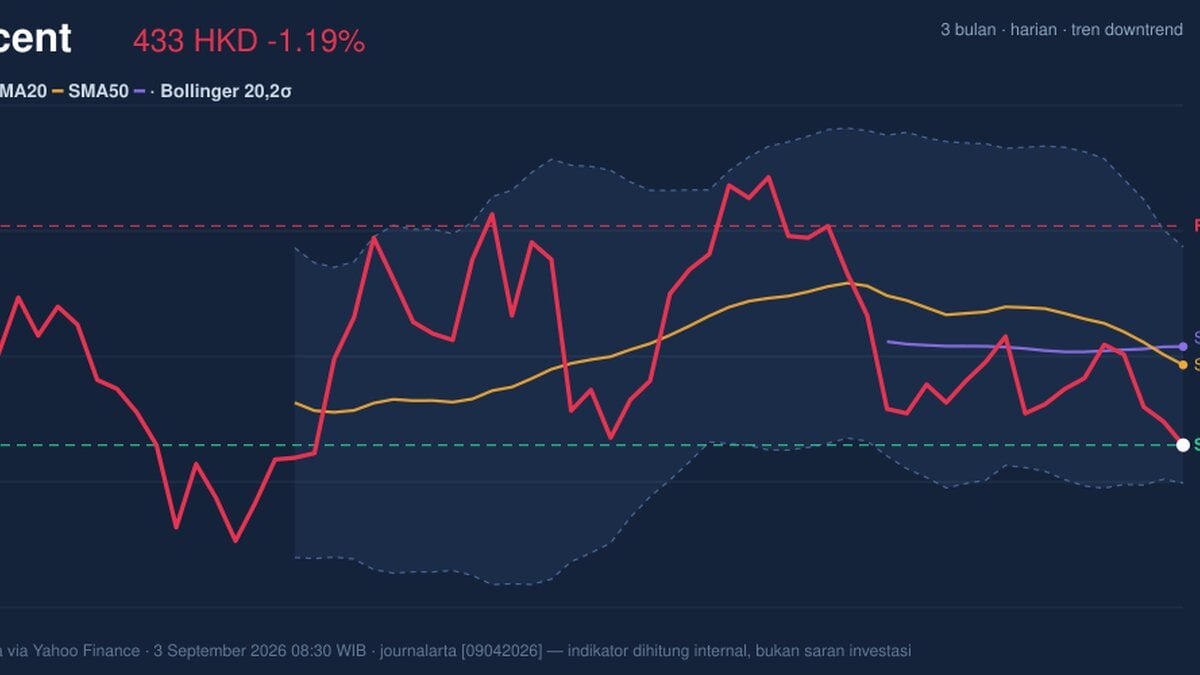
Tencent Holdings slipped on HKEX in Hong Kong on 3 September 2026, with 0700.HK last trading at HKD 433.00, down 1.19% from the previous close of HKD 438.20, as the stock continued to trade under pressure across the short-term chart. The move matters because it is not just a one-day wobble: Tencent is now below its SMA20 at HKD 450.70 and below its SMA50 at HKD 454.78, while the chart shows a death cross — a bearish crossover where the faster average falls below the slower one. In plain language, that usually signals that recent weakness has started to dominate the medium-term trend. The stock is also sitting near the lower edge of its recent range, which tells traders the market is testing whether buyers still have conviction.
Trend & Price Action
As shown in the chart, Tencent’s price structure is still tilted to the downside. The downtrend is reinforced by the SMA20 slope of -2.21% over 5 days, which means the short-term average is not just below price — it is actively falling. That matters because a declining moving average often acts like a moving ceiling: rallies can stall there if selling pressure returns. The stock’s 1-month decline of 9.64% also shows the weakness is broad enough to extend beyond a single session.
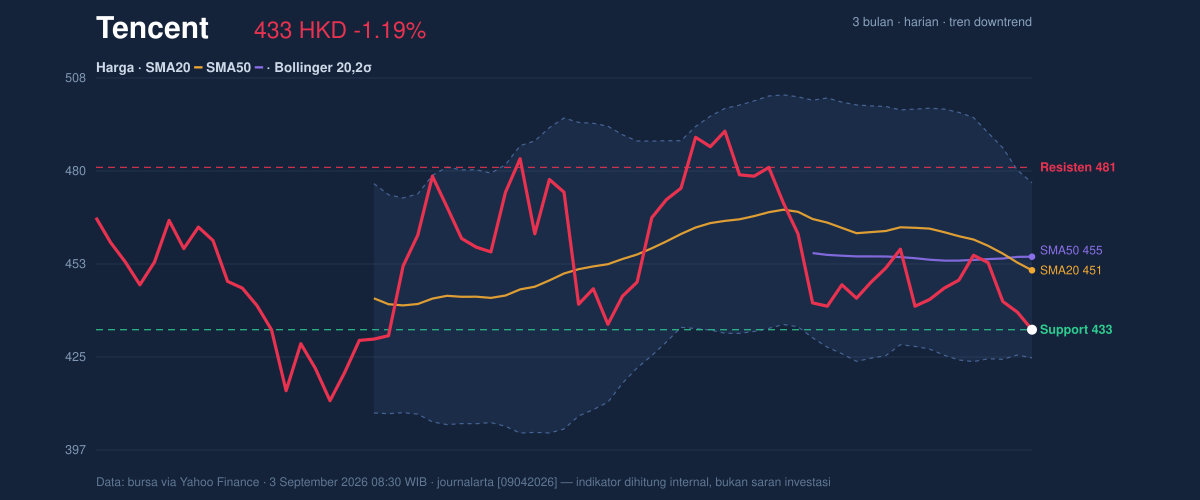
The current support at HKD 433.00 is especially important because price is sitting right on it, at 0% of the 20-hour range. That is a fragile position: if a support level is already being tested immediately, the market is effectively asking whether buyers can defend it or whether the next leg lower begins. On the upside, HKD 481.40 remains the nearest resistance in the 20-hour range, but the stock would first need to reclaim the moving averages before that ceiling becomes relevant again.
A weak base can still break.
Oscillators & Momentum
The momentum picture is mixed, but not in a constructive way. The RSI at 39.5 is technically neutral, which means the stock is not yet deeply oversold on that measure. But the Stochastic %K at 0.0 and %D at 10.8 is an oversold signal, showing the latest price action has been pushed to the lower end of its recent trading band. That can sometimes precede a bounce, but oversold readings alone do not reverse a downtrend; they only show that selling has become stretched.
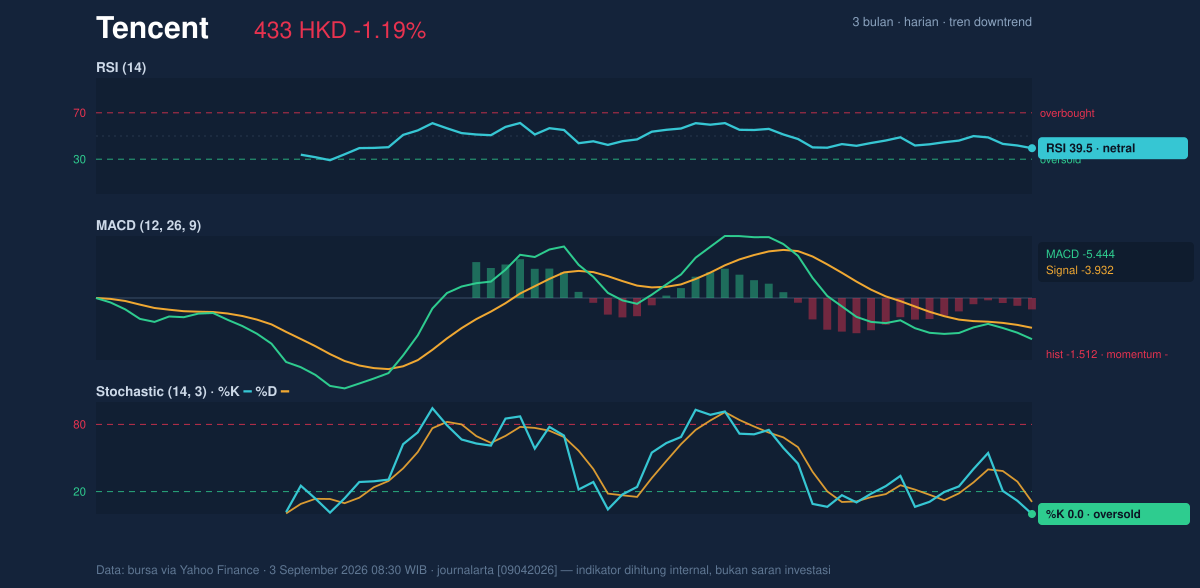
The stronger message comes from MACD. Tencent’s MACD at -5.444, below the signal line at -3.932, with a histogram of -1.512, confirms that downside momentum is still negative. In practical terms, MACD is telling traders that recent losses are moving faster than the trend is stabilizing. When MACD stays below signal and the histogram remains negative, the market is usually still in a momentum unwind rather than a clean reversal.
Volatility & Volume
Volatility is not extreme, but it is enough to matter. The ATR(14) of 10.91, equal to 2.5% of price, suggests Tencent can still move meaningfully in a single session without entering panic territory. Meanwhile, the Bollinger Bands show price near the lower band at HKD 424.58, with %B at 16% and a band width of 11.6%. That combination usually means the stock is trading in the lower part of its recent volatility envelope, but the band width is only normal rather than compressed. So this is not a classic squeeze setup where a sharp breakout is being stored up; instead, it is a weak tape sitting near support.
Volume does not yet confirm a strong reversal attempt. Last volume was 17,387,096, below the 20-day average of 22,802,071, or 0.8× normal. Lower-than-average volume during a decline can mean sellers are not panicking, but it can also mean buyers are not stepping in decisively. The OBV is falling, which is the more important tell: on-balance volume tracks whether money flow is accumulating or leaving the stock, and a declining OBV says participation has not yet shifted in Tencent’s favor.
Key Levels & Scenarios
The nearest technical map is clear. HKD 433.00 is the immediate support to watch, followed by the lower Bollinger band at HKD 424.58. Below that, the 3-month low at HKD 411.00 becomes the next reference point. On the upside, the first hurdle is HKD 450.70 at the SMA20, then HKD 454.78 at the SMA50, and only after that does HKD 476.82 at the upper Bollinger band and HKD 481.40 resistance come back into view.
If Tencent holds HKD 433.00 and momentum improves, the chart could try to stabilize toward the moving averages. If it falls below HKD 424.58, the lower band gives way and the market would likely begin probing the HKD 411.00 zone. The signal to watch is not just price, but whether volume and OBV start turning with it.
Technical Verdict: HOLD (wait & see)
- Why this verdict: the stock remains in a downtrend with a death cross, MACD is negative, and OBV is falling, which together argue against calling the move repaired.
- Why it is not a weaker verdict: Stochastic is oversold and price is sitting near support at HKD 433.00, so the chart is stretched enough that a reflex bounce cannot be ruled out.
- Invalidation condition: this verdict is invalidated if price falls below HKD 424.58, the lower Bollinger band and the next nearby technical floor.
- Ideal Entry Range: HKD 424.58 to HKD 433.00
- Exit Target: HKD 450.70 to HKD 454.78
- Stop Loss protection: below HKD 424.58
For non-traders: Tencent is weak, but it is also close to a support area where the next move will show whether the selling is simply stretched or still in control.
“If HKD 433.00 cannot hold, the chart stops arguing about a bounce and starts talking about lower levels.”
Summary Data Tencent
| Last price | 433.00 HKD |
| Change 1 day / 5 days / 1 month | -1.19% / -3.31% / -9.64% |
| Trend / MA-cross | downtrend / death |
| SMA20 / SMA50 | 450.70 / 454.78 |
| RSI (14) / Stochastic %K | 39.5 / 0.0 |
| Bollinger %B / ATR | 16% / 10.91 |
| Support / Resistance 20 days | 433.00 / 481.40 |
| Data as of | 3 September 2026 08:30 WIB |
Track Tencent share price daily: live levels, support/resistance and our full Tencent analysis history.