Testing Key Resistance, ORCL Stock Gains 5.69% Today
On September 4, 2026: price 154.04 USD, trend uptrend, RSI 56.5, support 141.32, resistance 156.22. technical analysis of orcl stock. Testing Key Resistance —…
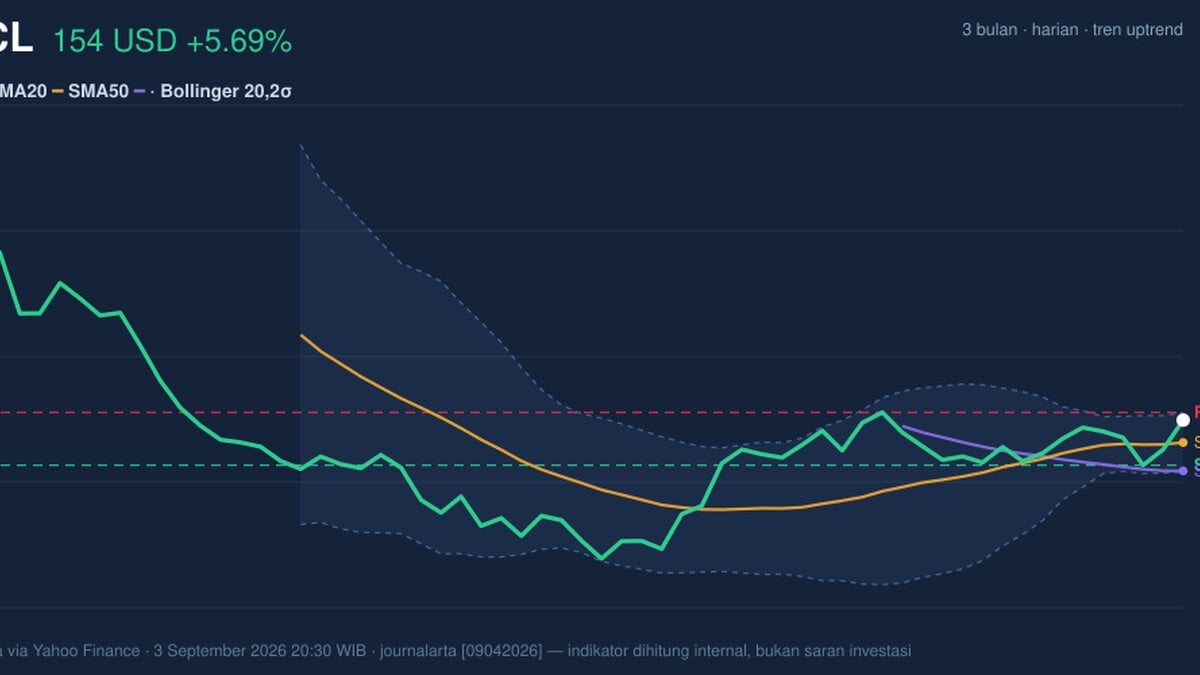
Oracle is trading higher in a market that is still rewarding earnings strength and punishing hesitation: the shares closed at 154.04 USD, up 5.69% on the day, and now sit just beneath a near-term ceiling that will test whether this move is a breakout or a fast climb into resistance. The stock’s position matters for global investors because Oracle is often treated as a proxy for enterprise software demand, cloud spending, and the durability of corporate IT budgets.
Trend & Price Action
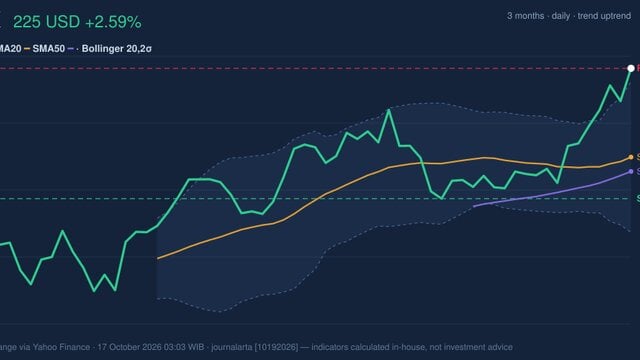
The chart shows a stock that is still in an established uptrend, not a stretched one. Oracle is trading above both its SMA20 at 147.72 and SMA50 at 139.71, which means the short-term and medium-term price structure are aligned in favor of buyers. The SMA20 slope of 1.23% over 5 days signals that the recent advance is not just a one-day spike; the average itself is rising, which usually indicates that momentum has been broad enough to lift the trend line, not just the last print. There is no fresh MA-cross, so this is not a new trend ignition; rather, it is a continuation phase.
That distinction matters. A stock can rise because it is breaking new ground, or because it is already well bid and running into overhead supply. Oracle is closer to the second case right now.
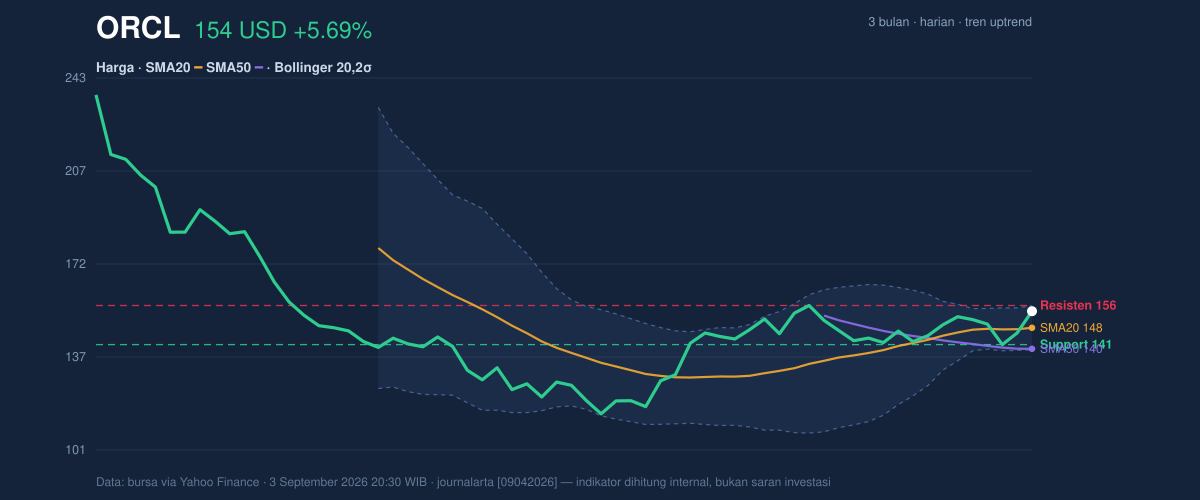
The share price is sitting near the top of its recent trading band, with support at 141.32 and resistance at 156.22. At 85% of the range, Oracle is already trading close to the upper end of that corridor, which often increases the chance of either a pause or a test of whether buyers have enough conviction to push through. The broader three-month range, from 114.50 to 238.95, shows there is still plenty of room between the current level and the year’s wider extremes, but the market is not pricing that room in a straight line.
Oscillators & Momentum
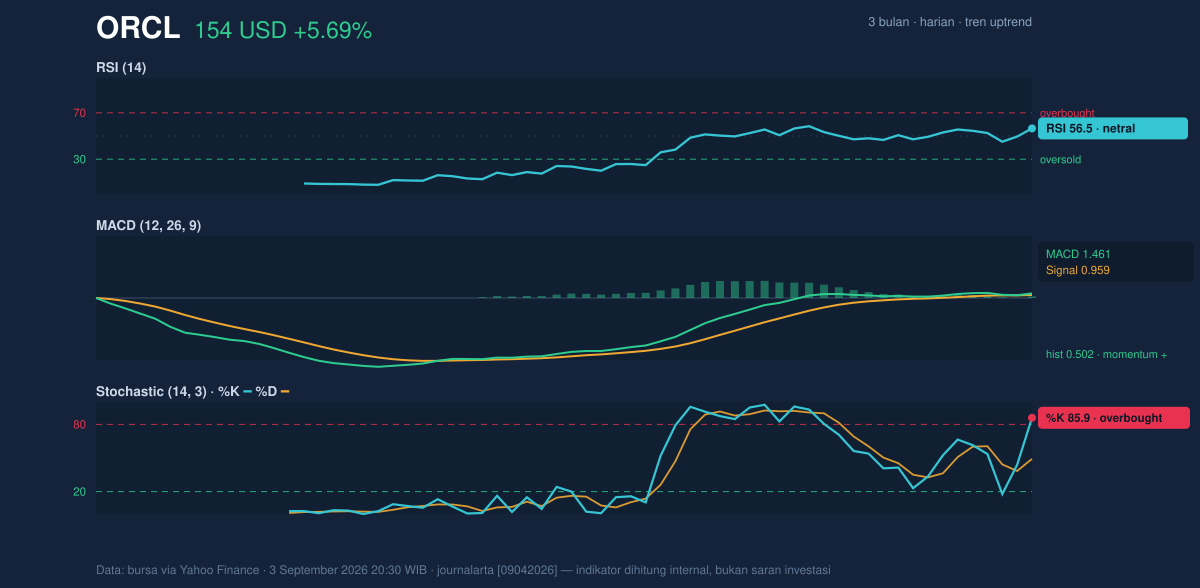
The momentum picture is mixed, and that is the key signal in this name. RSI at 56.5 is neutral, which means Oracle is neither overbought nor weak on this measure. In plain language, RSI is saying the stock has room to extend, but it is not yet showing the kind of urgency that usually accompanies a powerful breakout. By contrast, the Stochastic reading of 85.9 / 49.2 is in overbought territory, a sign that the stock has moved quickly relative to its recent range and may be vulnerable to a pause or short pullback if buyers hesitate.
The MACD at 1.461, above its signal line at 0.959 with a positive histogram of 0.502, is the strongest momentum confirmation in the set. MACD measures whether recent price action is accelerating relative to its longer baseline; here, it says the trend is still improving. That is why the current move cannot be dismissed as purely overstretched. The oscillator mix says the trend is alive, but it is no longer cheap in the short term.
Volatility & Volume
Oracle’s Bollinger upper band at 156.14 sits almost on top of the 156.22 resistance, which is a notable alignment. Bollinger Bands frame where a stock is trading relative to its recent average and expected volatility; when price approaches the upper band, it often means the market is testing the edge of its normal range. The %B reading of 88% confirms that Oracle is trading near that upper boundary, while the 11.4% band width suggests volatility is normal rather than compressed. In other words, this is not a squeeze waiting to explode; it is a stock already moving within an ordinary volatility envelope, now pressing against the top of it.
The ATR at 6.17, equal to 4.0% of price, adds another layer: daily swings are still large enough that a one-session move can easily matter. ATR is a gauge of typical daily movement, and at this level it warns that even in an uptrend, price can reverse sharply enough to test discipline quickly.
Volume supports the move, but only moderately. Last volume of 25,033,900 was about 1.1x normal versus the 20-hour average of 22,538,330, and OBV is rising. OBV, or on-balance volume, tracks whether volume is flowing in the same direction as price; a rising line suggests buyers are still participating rather than fading. The message is constructive, but not euphoric. The rally has support, yet not the kind of surge that usually marks a decisive breakout.
Key Levels & Scenarios
The immediate market question is simple: can Oracle clear the 156.14 to 156.22 zone, or does it stall just below it? If the shares push through that band with volume still above average, the chart would argue that the market is willing to re-price the stock higher within its current trend. If it fails there, the most logical first checkpoint is the 147.72 area, which is both the SMA20 and the Bollinger middle band. That level matters because it often acts as the line between a healthy trend and a short-term fade.
Below that, 141.32 support is the next important floor. A break beneath it would suggest the recent advance has lost traction and that the market is no longer respecting the current trend structure. With Stochastic overbought and price already near the upper band, the risk is less about collapse than about a cooling period unless resistance gives way.
Technical Verdict: HOLD (wait & see)
HOLD (wait & see)
- MACD is positive, so the trend still has upward momentum.
- Price is above SMA20 and SMA50, confirming the broader structure remains constructive.
- Stochastic is overbought and price is pressing against resistance at 156.22, so upside progress may slow here.
Verdict invalidated if price breaks below 141.32.
- Ideal Entry Range: 147.72 to 141.32, where the stock would be closer to support and the SMA20.
- Exit Target: 156.14 to 156.22, the Bollinger upper band and nearby resistance.
- Stop Loss protection: below 141.32, the nearest support level.
For non-traders: Oracle is still rising, but it is now close enough to resistance that the market needs to prove the move has more room.
“The stock is strong, but it is standing at the door, not yet through it.”
Summary Data ORCL
| Last price | 154.04 USD |
| Change 1 day / 5 days / 1 month | 5.69% / 1.38% / 7.37% |
| Trend / MA-cross | uptrend / none |
| SMA20 / SMA50 | 147.72 / 139.71 |
| RSI (14) / Stochastic %K | 56.5 / 85.9 |
| Bollinger %B / ATR | 88% / 6.17 |
| Support / Resistance 20 days | 141.32 / 156.22 |
| Data as of | 3 September 2026 20:30 WIB |
Track ORCL stock price daily: live levels, support/resistance and our full ORCL analysis history.