UOB Stock Technicals Today: Gains 0.77%, Death Cross Pressure
On September 4, 2026: price 41.74 SGD, trend sideways, RSI 52.0, support 40.22, resistance 43.58. technical analysis of uob stock. UOB Stock Technicals — full…
United Overseas Bank’s shares on the Singapore Exchange edged up to SGD 41.74 by 2 September 2026 08:00 WIB, a modest gain from the previous close of 41.42, but the chart still reads as a market that is searching for direction rather than breaking decisively away from its recent range. The stock is sitting slightly above its 20-day average, yet below its 50-day average, which tells investors the near-term tone is firmer than the longer-term one even as the broader pattern remains sideways. In plain terms, UOB is not in a strong uptrend or downtrend right now; it is moving inside a band, with buyers and sellers taking turns without either side gaining full control.
Trend & Price Action
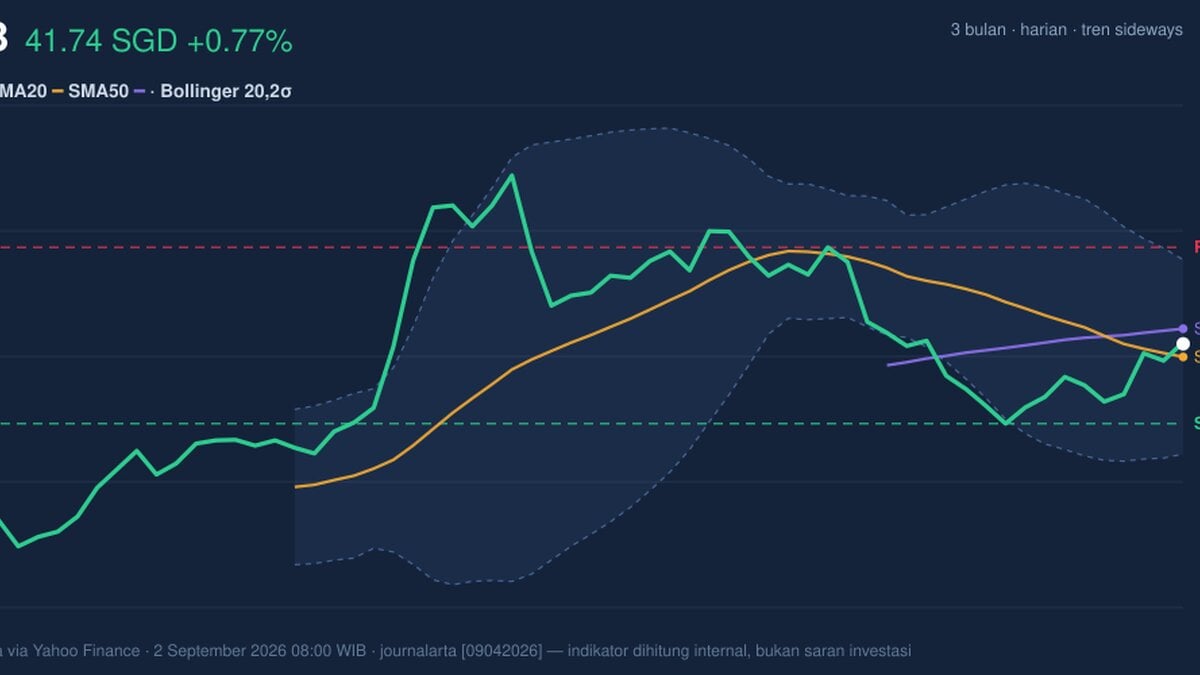
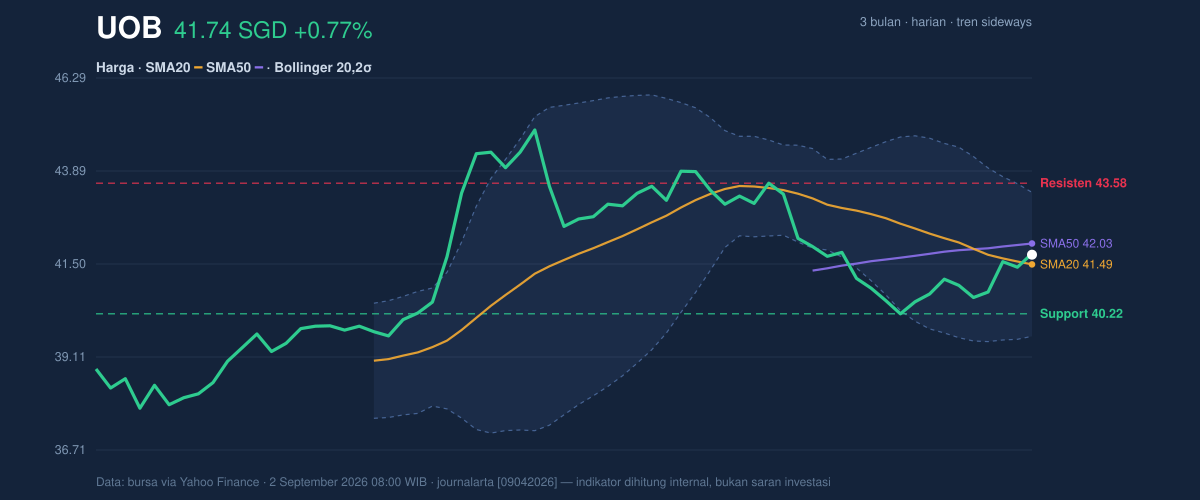
As shown in the chart, the share price is trading above SMA20 at 41.49 but below SMA50 at 42.03, a configuration that often signals a market in transition. The fact that the 20-day average is still sloping down by -1.34% over 5 days matters more than the small premium to SMA20: it suggests recent weakness has not fully cleared, and rallies are still being tested by overhead supply. The presence of a death cross — where SMA20 has crossed below SMA50 — reinforces that caution, because this crossover usually reflects a shift from short-term momentum support to short-term momentum resistance.
That said, the price is not languishing at the bottom of its range. It is positioned around 45% of the 20-day range, above the midpoint of the Bollinger envelope, which means the stock has recovered from softer levels but has not yet reached the upper boundary where profit-taking pressure typically intensifies. The 3-month range, from 37.52 to 45.15, shows the current quote is closer to the upper half of that band, a sign of resilience, though still short of a clear range breakout.
Oscillators & Momentum
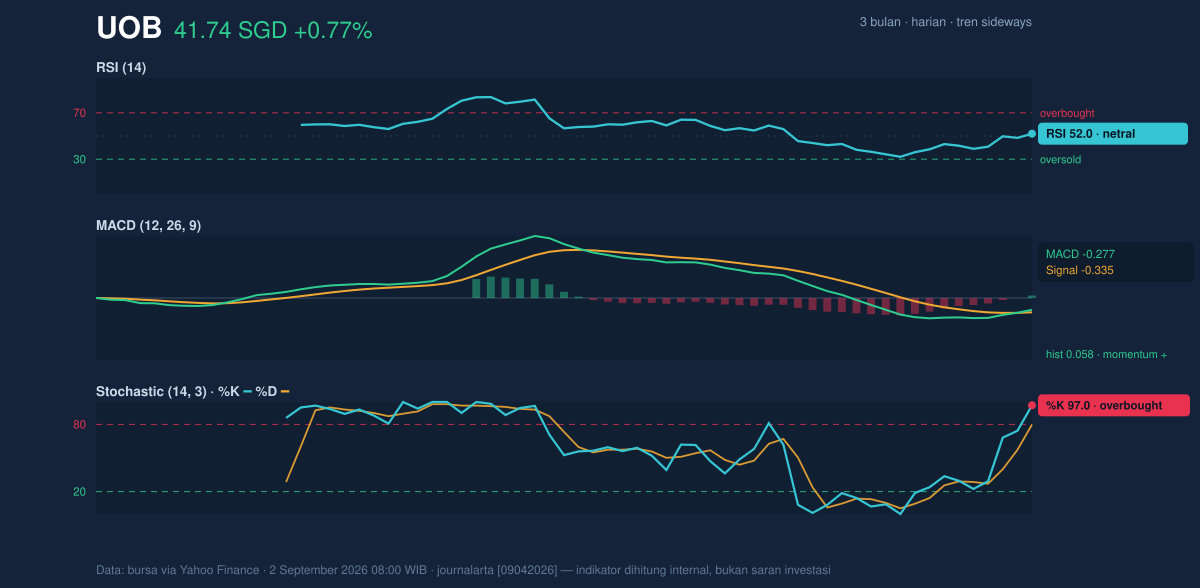
The momentum picture is mixed, and that mix is the key signal. RSI at 52.0 is neutral, which means the stock is neither stretched nor washed out and can still move either way without needing to “cool off” first. But the stochastic oscillator is flashing a different message: %K at 97.0 and %D at 79.9 are both in overbought territory, suggesting the latest push higher has been sharp enough to leave the short-term price rhythm vulnerable to a pause or pullback.
That divergence matters because it tells readers not to confuse a bounce with a trend change. The stochastic is sensitive to recent closes, so an overbought reading often means near-term enthusiasm has run ahead of itself, especially when volume is not confirming. By contrast, MACD at -0.277 with a signal line at -0.335 and a positive histogram of 0.058 indicates improving momentum beneath the surface. In practical terms, MACD is still below zero, so the broader momentum backdrop has not fully turned bullish, but the histogram above zero shows the gap is narrowing and the downside pressure is easing.
Volatility & Volume
Volatility is subdued. ATR at 0.56, or 1.3% of price, points to relatively calm trading conditions, which usually means the stock is not currently pricing in a sharp move. The Bollinger Bands are also telling a restrained story: the 8.9% band width is normal, not compressed to the point of an imminent squeeze and not expanded enough to suggest a disorderly breakout. With %B at 57%, price is slightly above the middle band at 41.49, which is consistent with mild recovery rather than momentum excess.
Volume adds an important check on the price move. The latest turnover of 2,707,500 is only about 0.7x normal versus the 20-day average of 3,723,295, so the advance has not yet been backed by broad participation. That weakens the signal from the positive MACD histogram and the rising OBV — a measure of whether volume is accumulating on up days — because rising OBV says money flow is improving even while the day’s volume is thin. This combination usually implies quiet accumulation or at least reduced selling pressure, but not yet the kind of conviction that would normally accompany a clean trend breakout.
Key Levels & Scenarios
The nearest technical map is clear. Support at 40.22 is the first level where buyers have recently stepped in, and it sits below the Bollinger middle line, making it a meaningful line of defense if the stock loses its current footing. On the upside, resistance at 43.58 is the immediate ceiling to watch; it sits just above the SMA50 at 42.03 and below the 3-month high of 45.15, so a move through it would signal that the stock is trying to reclaim the upper part of its range.
If price can hold above 41.49 and push through 42.03, the chart would begin to look less like a stalled rebound and more like a constructive base-building phase. If it fails to hold 40.22, the recent recovery would lose credibility and the market would likely revisit the lower half of the 3-month range. The middle of the Bollinger band at 41.49 is therefore the pivot that separates a stabilizing tape from one that is slipping back into weakness.
Technical Verdict: HOLD (wait & see)
HOLD (wait & see)
- Reason 1: Price is above SMA20 at 41.49 but still below SMA50 at 42.03, while the chart also shows a death cross — a mixed structure, not a clean trend.
- Reason 2: RSI at 52.0 is neutral, but Stochastic at 97.0 / 79.9 is overbought, so short-term upside may be stretched.
- Reason 3: MACD histogram at 0.058 is positive and OBV is rising, which supports the case for stabilization, but volume is only 0.7x normal, so confirmation is still thin.
- Verdict invalidated if price breaks below 40.22, because that would undermine the current support base and reopen the lower end of the 3-month range.
- Ideal Entry Range: 41.49 to 42.03
- Exit Target: 43.58
- Stop Loss protection: 40.22
For non-traders, this means UOB’s share price looks steadier than it did, but the chart still needs stronger confirmation before the move can be called decisive.
Summary Data UOB
| Last price | 41.74 SGD |
| Change 1 day / 5 days / 1 month | 0.77% / 1.93% / -3.49% |
| Trend / MA-cross | sideways / death |
| SMA20 / SMA50 | 41.49 / 42.03 |
| RSI (14) / Stochastic %K | 52.0 / 97.0 |
| Bollinger %B / ATR | 57% / 0.56 |
| Support / Resistance 20 days | 40.22 / 43.58 |
| Data as of | 2 September 2026 08:00 WIB |
Track UOB share price daily: live levels, support/resistance and our full UOB analysis history.