AIA Stock Gains 0.26% Today, Testing Key Resistance
On September 7, 2026: price 77.50 HKD, trend sideways, RSI 60.9, support 70.40, resistance 77.50. technical analysis of aia stock. AIA Stock Gains — full…
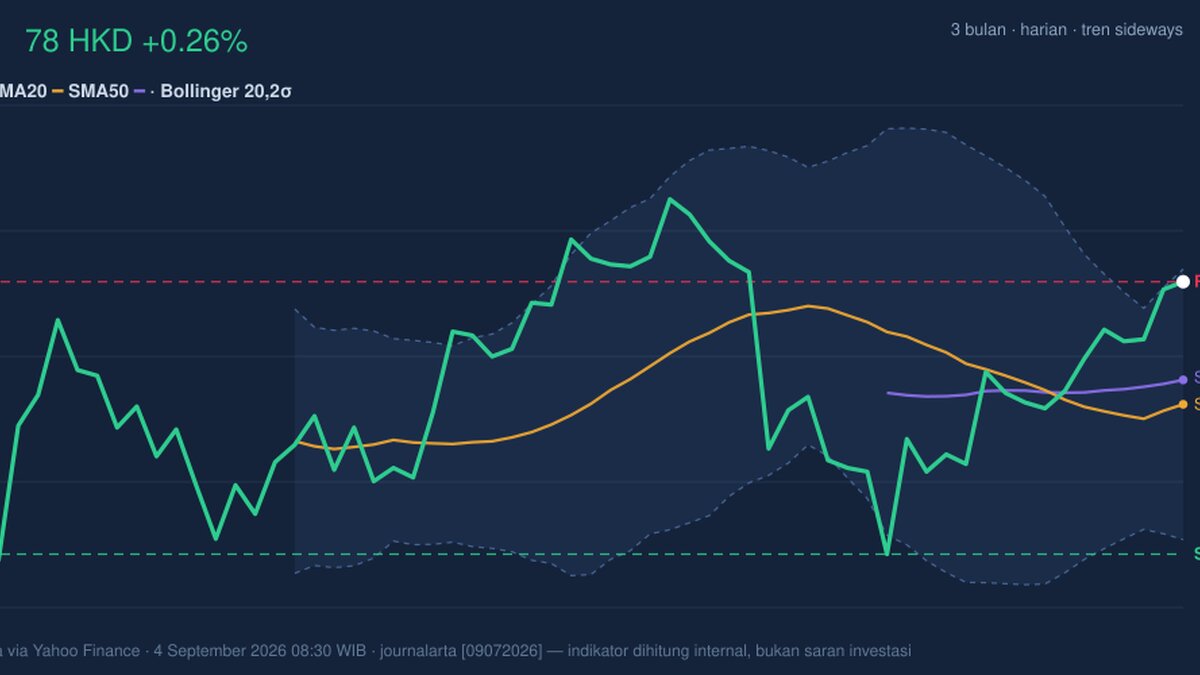
77.50 HKD is holding just above its short-term averages, but the stock is now pressing against the top of its recent trading band, with the latest move leaving little room before the chart’s next ceiling. AIA Group’s HKEX-listed shares rose 0.26% on the day, 2.65% over five days and 4.52% over one month, according to exchange-based data as of 4 September 2026. That combination matters: the stock is not in a breakout sprint, but it is steadily rebuilding after a softer patch, and the technical picture now hinges on whether momentum can justify trading at the upper edge of the range.
Trend & Price Action
The broader pattern is still best described as sideways, even though the price sits above SMA20 at 74.31 and also above SMA50 at 74.94. That positioning is constructive because it shows the shares have reclaimed both near- and medium-term trend markers. But the slope of SMA20 is only 0.09% over five days, which signals a market that is advancing gently rather than with conviction.
The absence of a fresh MA-cross reinforces that reading. In plain terms, the faster average has not delivered a decisive trend signal over the slower one, so the chart is still in transition rather than in a fully established uptrend. As shown in the chart, the price is also sitting at 100% of the 20-hour range, with 20-hour resistance at 77.50 and support at 70.40. That is important because when a stock closes at the top of its recent range, it often needs either strong follow-through or a pause.
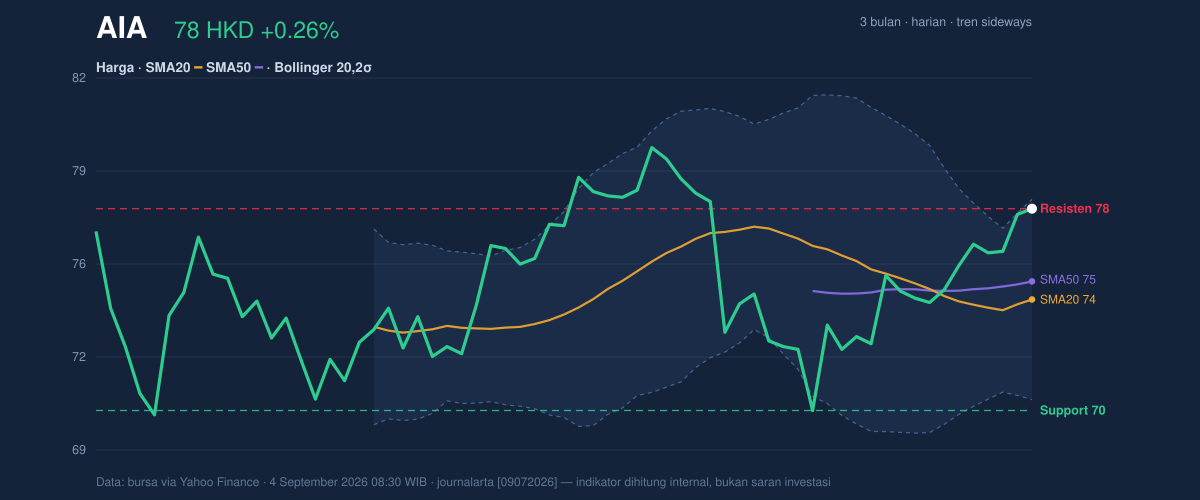
The 3-month high of 81.65 and 3-month low of 69.05 frame the bigger picture. AIA is closer to the upper half of that band, which says the recovery has room left, but not much margin for complacency. The market is effectively asking whether this move is a genuine re-rating of the chart or simply a test of overhead supply.
Oscillators & Momentum
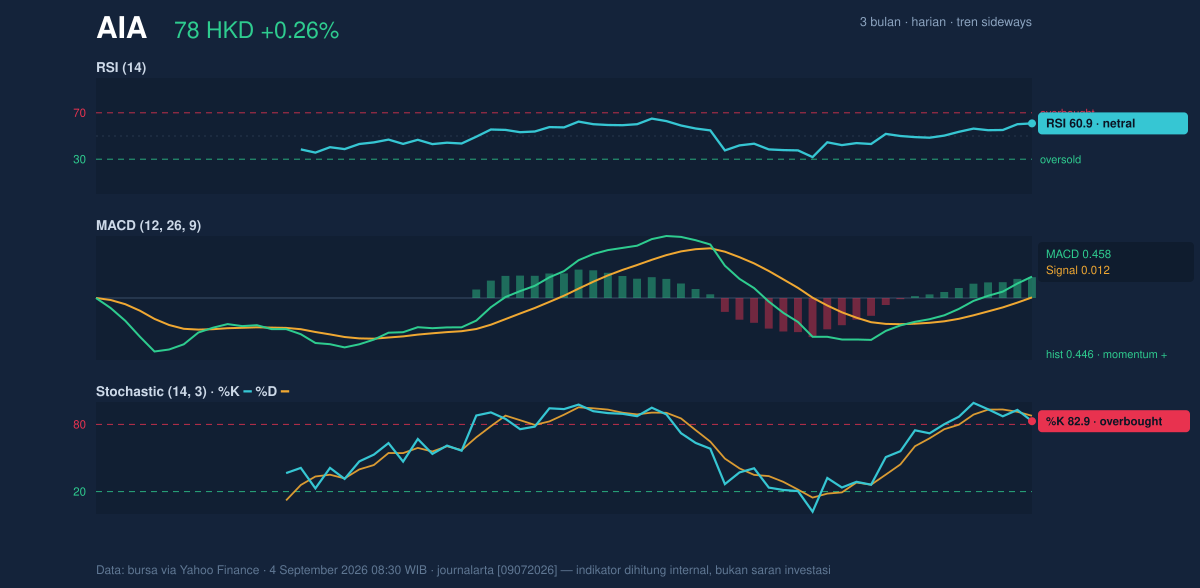
Momentum is mixed, and that mix is the key signal. RSI at 60.9 is still neutral, which means the stock is not yet stretched in a classic overbought sense. But the Stochastic %K at 82.9 and %D at 87.7 are both in overbought territory. That usually tells traders the latest push has been strong enough to lift the stock near its short-term limit, even if the broader trend is not exhausted.
The contrast matters. RSI is the slower, steadier gauge, while Stochastic reacts faster to recent price movement. Here, Stochastic is flashing a warning that the near-term advance may be getting crowded, while RSI has not yet confirmed an outright reversal risk. That is why the chart looks firm, but not cleanly impulsive.
The brighter side is the MACD at 0.458, with signal at 0.012 and a histogram of 0.446. MACD turning positive and staying above its signal line usually means upward momentum is still in place. In practical terms, the trend engine is running, but the overbought Stochastic readings suggest it may need a pause before it can accelerate again.
Volatility & Volume
Bollinger Bands add another useful layer. The stock is trading near the upper band, with upper Bollinger at 77.83, middle at 74.31 and lower at 70.78. The %B reading of 95% shows price is hugging the top of the band, which usually means the market is pricing in optimism already. That does not automatically mean reversal, but it does mean upside is being tested at a technically sensitive level.
The Bollinger band width of 9.5% is normal, not compressed. So this is not a squeeze waiting to explode; it is a more orderly market where price has room to move, but without the pressure-cooker setup that often precedes a sharp break. Meanwhile, ATR at 1.77, or 2.3% of price, points to moderate volatility. That suggests daily swings are present, but not extreme enough to imply disorder.
Volume supports the move, though only modestly. The latest volume of 29,691,804 is close to the 20-day average of 30,577,109, or about 1.0x normal. That is a sign of participation, but not a surge of conviction. The more encouraging detail is that OBV is rising, which means volume has been leaning in the same direction as price. In technical analysis, that often helps validate a gradual advance, even when the headline volume number itself is unremarkable.
Key Levels & Scenarios
The chart’s immediate battleground is clear. 77.50 HKD is both the latest price and the current resistance marker. A decisive move above that area would tell the market the stock is no longer just testing the top of its range. On the downside, 74.31 is the SMA20 pivot, while 70.40 is the stronger support level from the 20-hour range. Below that, the next important reference is the 3-month low of 69.05.
If the stock holds above 74.31 and can remain near or above 77.50, the chart would favor continued consolidation at elevated levels. If it fails to hold the 74.31 area, the market would likely be signaling that the recent push was more exhaustion than expansion. And if 70.40 gives way, the technical tone would weaken materially because the price would be slipping out of its recent support structure.
Technical Verdict: HOLD (wait & see)
HOLD (wait & see)
- MACD is positive, so the medium-term momentum remains supportive.
- Stochastic is overbought, which warns the short-term move may be stretched.
- Price is at 100% of the 20-hour range and near the upper Bollinger band at 77.83, leaving limited immediate upside without a breakout.
Verdict invalidated if price falls below 70.40.
- Ideal Entry Range: 74.31 to 77.50
- Exit Target: 77.83, then 81.65
- Stop Loss protection: 70.40
In plain English, the chart says AIA is firm, but it is already close to a short-term ceiling.
Summary Data AIA
| Last price | 77.50 HKD |
| Change 1 day / 5 days / 1 month | 0.26% / 2.65% / 4.52% |
| Trend / MA-cross | sideways / none |
| SMA20 / SMA50 | 74.31 / 74.94 |
| RSI (14) / Stochastic %K | 60.9 / 82.9 |
| Bollinger %B / ATR | 95% / 1.77 |
| Support / Resistance 20 days | 70.40 / 77.50 |
| Data as of | 4 September 2026 08:30 WIB |
Track AIA share price daily: live levels, support/resistance and our full AIA analysis history.