AMD Momentum Gains: Stock Gains 4.69% (September 7, 2026)
On September 7, 2026: price 477.57 USD, trend sideways, RSI 49.8, support 456.16, resistance 514.39. technical analysis of amd stock. AMD Momentum Gains — full…
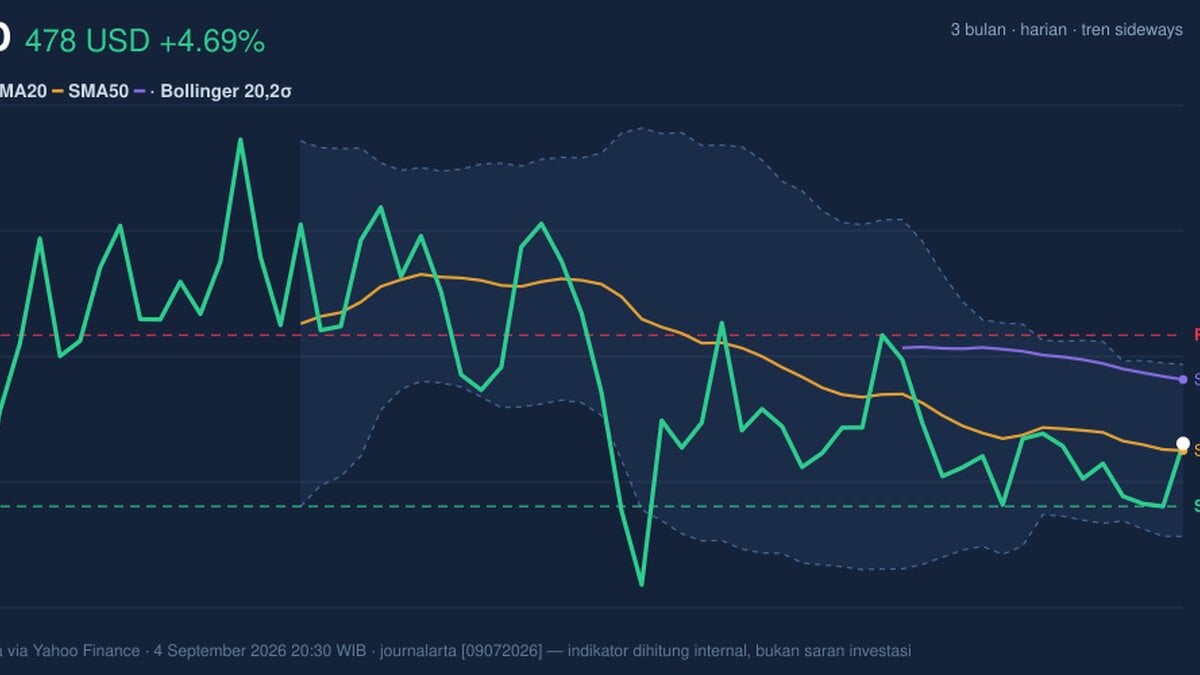
AMD is trying to recover, but the chart still says the move is tentative rather than decisive: the stock finished at 477.57, above its short-term average yet still below the longer trend line, with momentum improving but not fully confirmed.
Advanced Micro Devices rose 4.69% from the previous close of 456.16 in the latest session on Nasdaq, according to market data cited via Yahoo Finance. That move matters because it pulled the shares back above the SMA20 at 475.20, a level traders often watch as a rough dividing line between short-term weakness and stabilization. But the bigger picture remains mixed: AMD is still below the SMA50 at 499.27, which means the stock has not yet reclaimed the medium-term trend. In plain language, the latest bounce is encouraging, but it has not yet proved that the broader downshift has ended.
Trend & Price Action
The chart shows AMD in a sideways pattern, not a clean uptrend or downtrend. That fits the data: the SMA20 is sloping down by 1.42% over 5 days, which signals that recent price action has been soft even as the latest session improved. The stock is trading above the short-term average, but below the SMA50 at 499.27, so the market is still working through overhead supply from earlier buyers who may want out near breakeven.
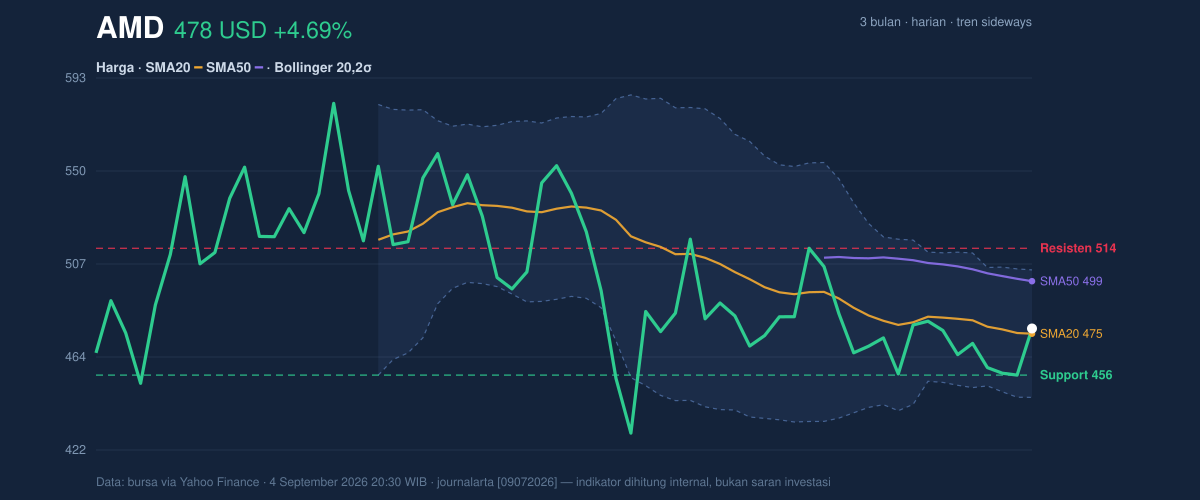
The position inside the recent range also matters. AMD closed at about 37% of the 20-hour range, with support at 456.16 and resistance at 514.39. That puts the shares closer to the lower half of the range than the top, even after the rebound. The broader 3-month high of 584.73 and low of 424.03 frame the current move as a recovery attempt inside a still-wide band, rather than a breakout from a tight base.
Oscillators & Momentum
Momentum is the part of the chart that has started to turn, but only cautiously. The RSI at 49.8 is neutral, which means AMD is neither overbought nor oversold. That is important because it suggests the latest gain has not yet pushed the stock into an exhausted condition, but it also shows there is no strong momentum regime in place. The Stochastic %K at 72.2 and %D at 33.9 points to a faster rebound than the slower signal line, a setup that often appears when short-term buying returns before the broader trend confirms it.
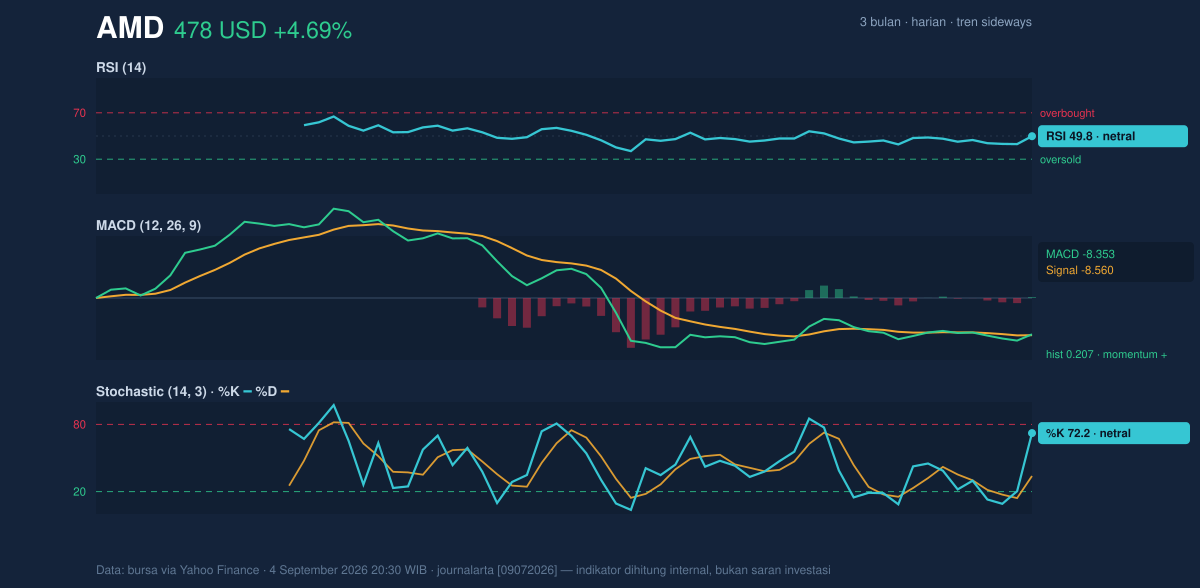
The more constructive signal comes from MACD at -8.353, with the signal line at -8.560 and a positive histogram of 0.207. MACD is still below zero, so the stock has not moved into full bullish territory, but the histogram turning positive means downside momentum is easing and the shorter-term trend is improving relative to the longer one. In simple terms, the chart is no longer saying “sell pressure is accelerating”; it is saying “the pressure may be fading.”
Volatility & Volume
Volatility remains a real feature of this name. The ATR at 18.48, equal to 3.9% of price, means daily swings are still large enough to matter, especially around the current inflection zone near the Bollinger middle band. The Bollinger Bands show price near the middle at 475.20, with the upper band at 504.46 and lower band at 445.94. The %B at 54% says AMD is only slightly above the midpoint of the band structure, not pressing into the upper edge. The 12.3% band width is normal, which suggests the market is not in a squeeze that would typically precede a sharp breakout; instead, the stock is moving within a fairly standard volatility envelope.
Volume adds a subtle but important nuance. Last session’s volume was 19,651,900, above the 20-session average of 17,504,245, or about 1.1× normal. That tells us the rebound had participation. But OBV is still falling, and that is the caution flag: on-balance volume tracks whether money is flowing in over time, and a decline there means the latest price bounce has not yet been backed by durable accumulation. The market is participating in the bounce, but not yet voting with conviction.
Key Levels & Scenarios
The immediate map is straightforward. Support at 456.16 is the first line to watch; it is also the prior close, which often becomes a psychological reference point after a strong rebound. Below that, the Bollinger lower band at 445.94 becomes the next technical cushion. On the upside, resistance at 514.39 is the first major barrier, while the SMA50 at 499.27 sits just beneath it and may act as a staging point or a ceiling depending on how the next sessions unfold.
If AMD holds above the 475.20 area and continues to build volume, the chart would start to suggest that the recent bounce is evolving from a reflex rally into a more durable recovery. If it fails to hold 456.16, the tone shifts quickly back toward the lower band and the market would be signaling that the rebound has run out of steam.
Technical Verdict: HOLD (wait & see)
HOLD (wait & see) is the clearest reading from the current setup.
- MACD is improving with a positive histogram, but it remains below zero, so trend repair is incomplete.
- RSI at 49.8 is neutral, and the stock is still below the SMA50 at 499.27, which limits trend confirmation.
- Volume was above average, yet OBV is down, so the bounce has not been fully validated by accumulation.
- Ideal Entry Range: between 475.20 and 456.16, where the stock is testing short-term support and the Bollinger middle band.
- Exit Target: 499.27 first, then 514.39 if momentum extends into resistance.
- Stop Loss protection: below 445.94, which is the Bollinger lower band and the next visible technical floor.
Verdict invalidated if price breaks below 445.94.
For non-traders, that means AMD’s chart is improving, but it has not yet shown enough proof that the recovery can stand on its own. “The next move has to earn trust,” one trader might say, “because right now the bounce is real, but the conviction is not.”
Summary Data AMD
| Last price | 477.57 USD |
| Change 1 day / 5 days / 1 month | 4.69% / 2.58% / -1.20% |
| Trend / MA-cross | sideways / none |
| SMA20 / SMA50 | 475.20 / 499.27 |
| RSI (14) / Stochastic %K | 49.8 / 72.2 |
| Bollinger %B / ATR | 54% / 18.48 |
| Support / Resistance 20 days | 456.16 / 514.39 |
| Data as of | 4 September 2026 20:30 WIB |
Track AMD stock price daily: live levels, support/resistance and our full AMD analysis history.