LLY Stock Drops 1.01%, Golden Cross Formed In Focus
On October 21, 2026: price 1,270.75 USD, trend uptrend, RSI 66.1, support 1,142.85, resistance 1,283.66. technical analysis of lly stock.
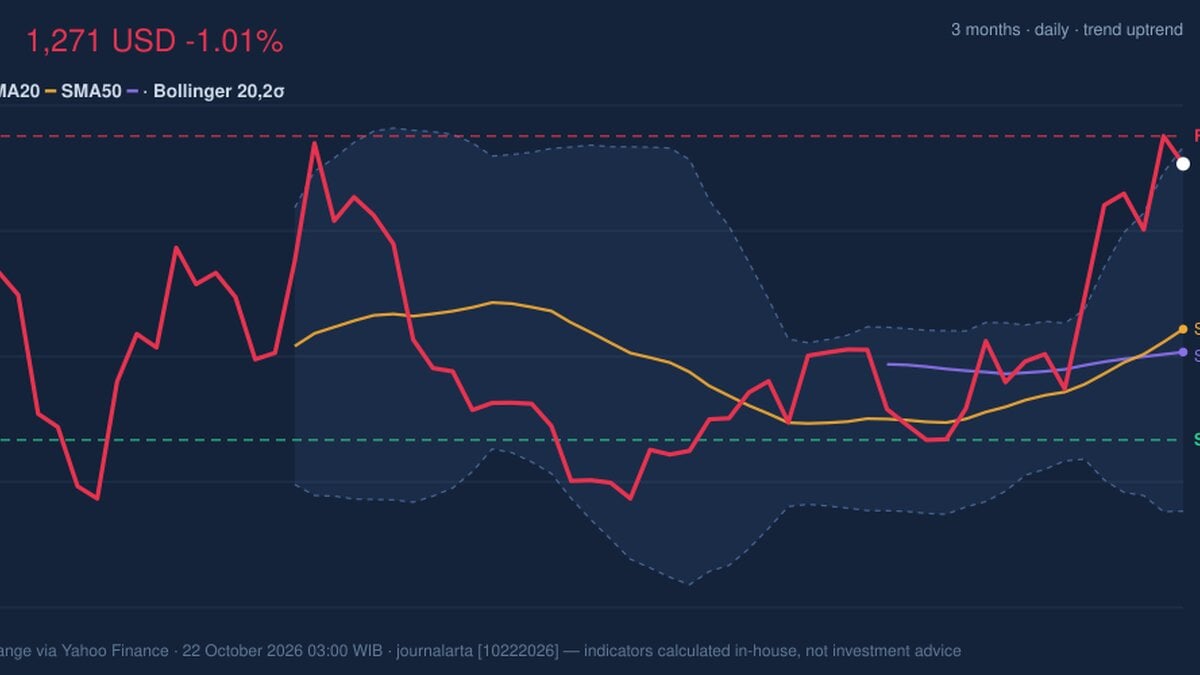
Why LLY is in focus today
- Fresh golden cross: SMA20 crossed above SMA50
- Uptrend confirmed (5-day change 5.13%)
Selected automatically from 30 NYSE (US) stocks by a technical-signal score with daily weighted randomisation — not a recommendation.
Trend & Price Action
LLY trades above its 20-day simple moving average of $1,194.20 and its 50-day average of $1,183.59. The 20-day average has risen 2.19% over five trading days and crossed above the 50-day average, forming a golden cross—a technical signal that recent price strength has overtaken the longer, slower trend. It supports the case for an uptrend, though it does not guarantee that gains will continue. The shares have climbed 10.40% over one month and sit at 91% of their 20-trading-day range, close to the $1,283.66 resistance level. That is also the previous close. The three-month high is $1,311.75, while the three-month low is $1,109.15. In other words, the shares are pressing toward the upper end of their recent range, where further progress may require fresh buying interest.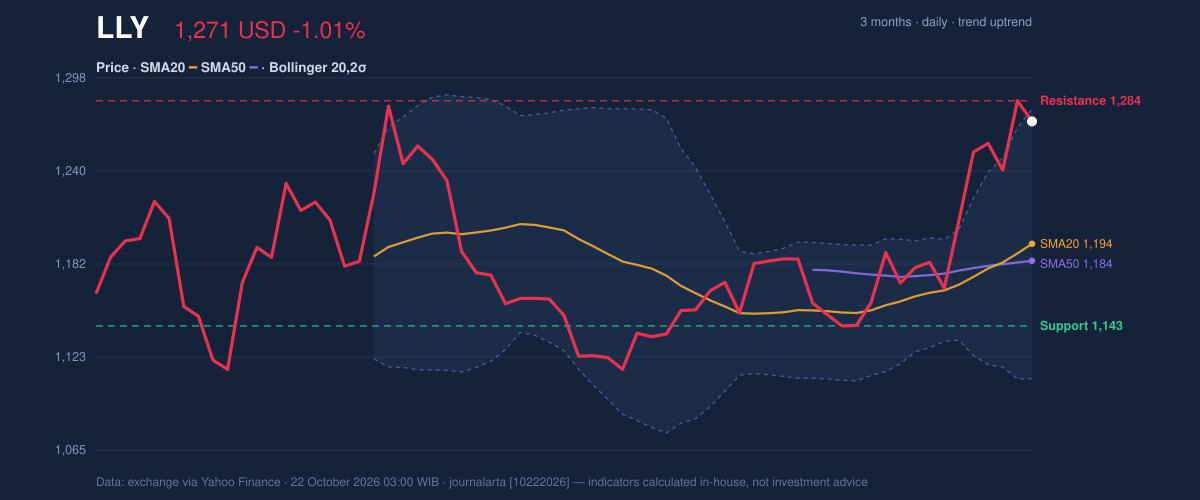
Oscillators & Momentum
Momentum indicators broadly confirm the rising trend, but show that the shares have already made a substantial move. The RSI is 66.1, in the data’s neutral range. RSI compares recent gains with losses: a higher reading indicates stronger upward momentum, but this reading does not by itself signal an extreme. The Stochastic readings are also neutral, with %K at 77.3 and %D at 79.1. This indicator compares the latest price with its recent range; the slightly lower %K suggests a modest easing in momentum relative to %D, not a confirmed reversal. Meanwhile, MACD remains positive: its 25.445 reading is above the 13.577 signal line, with a positive histogram of 11.868. That spread points to upward momentum still holding, despite the latest daily decline.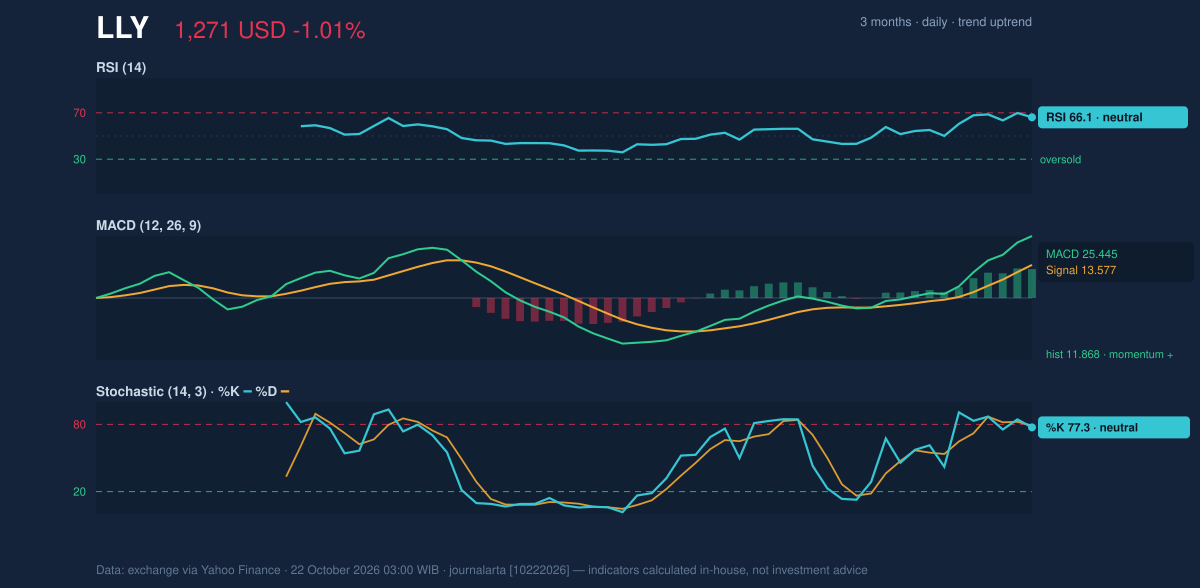
Volatility, Volume & Key Levels
The average true range, a measure of typical price movement, is $37.99, or 3.0% of the share price—moderate volatility by the supplied data. That makes the nearby resistance especially relevant: a move above $1,283.66 would put the shares closer to their three-month high, while failure to hold gains could bring the $1,194.20 moving-average area into view. Trading volume was 1,874,070 shares, about 0.8 times the 20-day average of 2,285,959. The advance therefore lacks unusually heavy volume in the latest session, tempering the strength of the price signal. On the other hand, the on-balance volume indicator is rising, suggesting cumulative buying pressure has continued to improve. The signals are mixed: participation was subdued in the latest session, but the broader volume trend is supportive. The nearest supplied reference points are $1,283.66 resistance and $1,142.85 support. A sustained move through resistance would strengthen the breakout case; a decline below support would undermine the current upward structure. Between those levels, the rising averages and positive MACD favor the trend, while proximity to the upper band argues for caution about chasing the latest move.Technical Verdict: HOLD (wait & see)
HOLD (wait & see) best fits the mixed technical picture: the golden cross, rising OBV and positive MACD support the trend, but the price is near resistance and the upper Bollinger band, with the latest volume below its average.- Ideal entry range: $1,194.20–$1,283.66, bounded by the 20-day average and 20-day resistance.
- Exit target: $1,311.75, the three-month high.
- Stop-loss protection: $1,142.85, the 20-trading-day support.
Summary Data LLY
| Last price | 1,270.75 USD |
| Change 1 day / 5 days / 1 month | -1.01% / 5.13% / 10.40% |
| Trend / MA-cross | uptrend / golden |
| SMA20 / SMA50 | 1,194.20 / 1,183.59 |
| RSI (14) / Stochastic %K | 66.1 / 77.3 |
| Bollinger %B / ATR | 95% / 37.99 |
| Support / Resistance 20 days | 1,142.85 / 1,283.66 |
| Data as of | 22 October 2026 03:00 WIB |
Disclaimer: This technical analysis is generated automatically from exchange data (via Yahoo Finance) and indicators calculated by JournalArta, for information and education only. The verdict and the entry, target and stop-loss levels are not investment advice or a solicitation to buy or sell any security. Investment decisions and their risks rest solely with the reader.
Track LLY stock price daily: live levels, support/resistance and our full LLY analysis history.