HD Stock Technicals: Drops 0.31% on Wednesday, Testing Key Resistance
On October 21, 2026: price 314.14 USD, trend sideways, RSI 63.2, support 281.15, resistance 315.11. technical analysis of hd stock. HD Stock Technicals — full…
By matthew jonathan
October 22, 20264 min read
HD Stock Technicals
According to exchange data carried by Yahoo Finance, Home Depot shares slipped 0.31% to $314.14 on Oct. 22, while remaining up 6.30% over five trading days and 5.87% over one month. The stock is pressing the upper end of its recent range: that places a positive short-term move alongside a clear caution signal, as price approaches resistance with momentum indicators showing some near-term heat.
Trend & Price Action
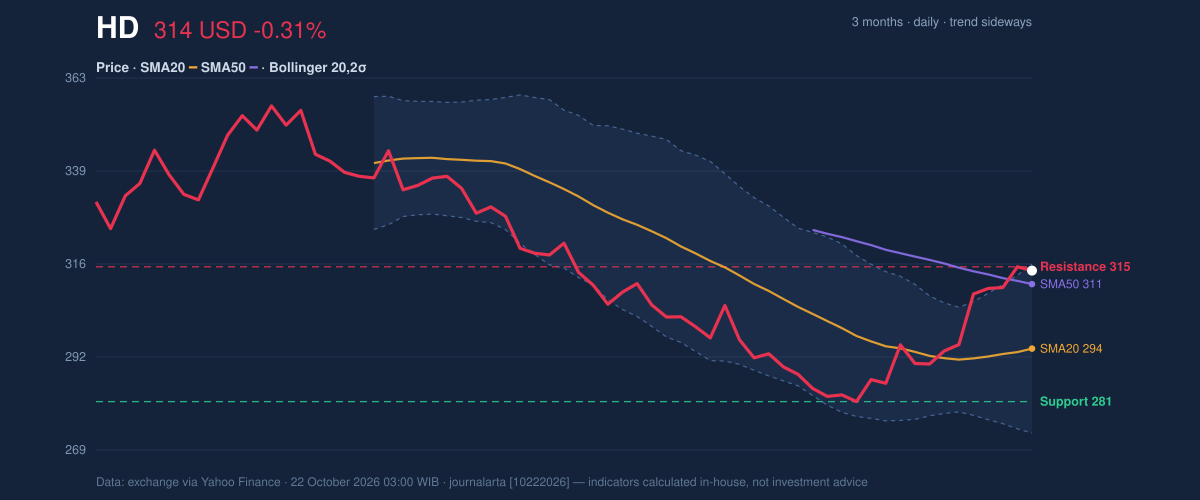
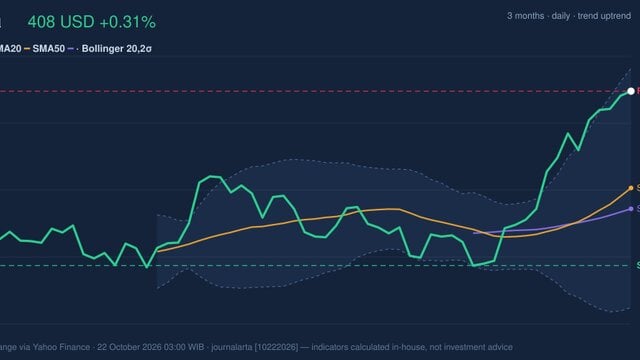
Home Depot’s trend is classified as sideways, but the short-term structure has improved. The share price stands above its 20-day simple moving average (SMA), at $294.50, and its 50-day SMA, at $310.74. The 20-day average has risen 0.95% over five trading days, suggesting recent strength, though there has been no new crossover between the two averages to confirm a broader trend shift.
The stock is near the top of its 20-trading-day range: $315.11 resistance is just above the latest close, while support is $281.15. It is also near the upper Bollinger Band at $315.77. Bollinger Bands track price movement around an average; a close to the upper band shows that price has advanced toward the top of its recent statistical range, not that a reversal is assured. Home Depot remains below its three-month high of $358.36 and above its low of $277.15.
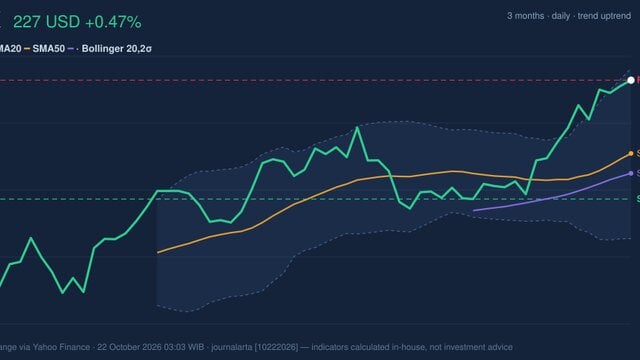
The price structure is firm, but it is testing a nearby ceiling rather than breaking into clear open space.3-month price action chart of HD: price, SMA20/50, Bollinger, support & resistance. Data: exchange via Yahoo Finance.
Oscillators & Momentum
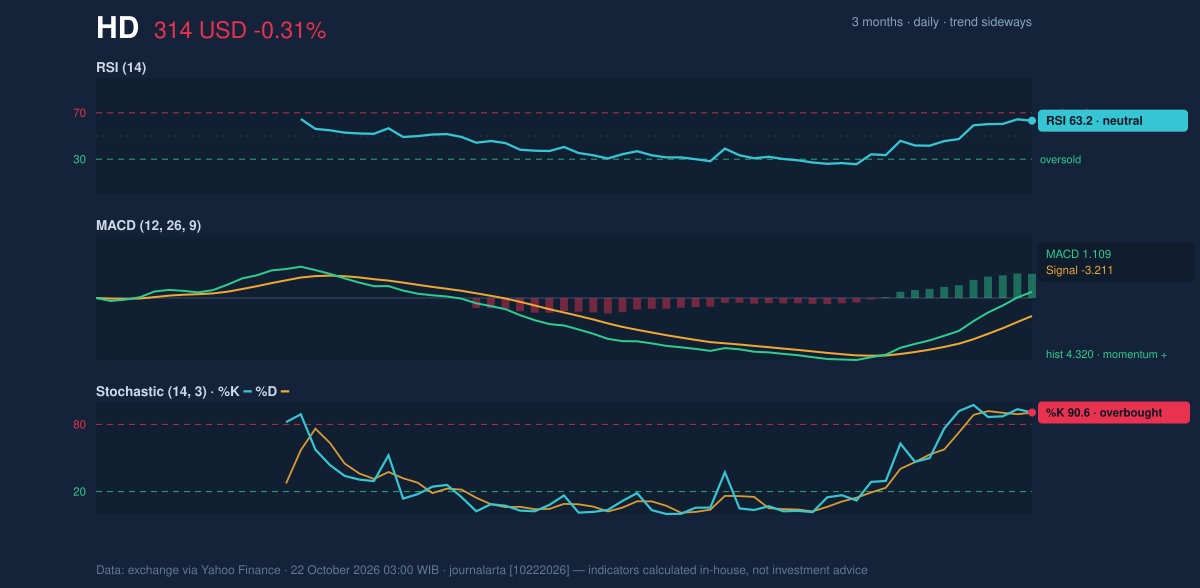
Momentum readings are positive but not uniformly comfortable. The 14-day Relative Strength Index (RSI), a measure of the pace of recent gains and losses, is 63.2 and classified as neutral. That indicates strengthening momentum without an RSI reading that the supplied data labels overbought. The Stochastic oscillator, which compares the latest price with its recent range, is more stretched: %K is 90.6 and %D is 90.5, both in overbought territory. Such readings can persist during an advance, but they also warn that the move may be vulnerable to a pause.
The MACD histogram is positive at 4.320, with MACD at 1.109 and its signal line at -3.211. The histogram’s positive reading points to improving momentum relative to the signal line. Taken together, MACD supports the recent advance, while Stochastic argues that the pace may be difficult to sustain without consolidation.
Momentum chart of HD: RSI(14), MACD, Stochastic. Data: exchange via Yahoo Finance.
Volatility, Volume & Key Levels
The 20-day Bollinger Band width is 14.4%, described as normal rather than unusually compressed or expanded. Its %B reading of 96% places price close to the upper band, reinforcing the resistance test. Average True Range (ATR), a measure of typical daily price movement, is $6.61, or 2.1% of the share price; volatility is therefore moderate in the supplied data, not negligible.
Participation is a notable qualification. The latest session’s volume of 2,897,459 shares was about half the 20-day average of 5,477,858, a thin reading that offers limited confirmation of the advance. On the other hand, On-Balance Volume (OBV), which uses trading volume to track buying and selling pressure, is rising. The signals are mixed: the broader volume indicator is constructive, but the latest session itself was quiet.
A close above $315.11 would clear the stated 20-day resistance, while failure to hold the rising short-term structure would leave support levels in focus. The $315.77 upper Bollinger Band is another nearby reference. If the share price retreats, the $310.74 50-day average and then the $294.50 20-day average are intermediate markers; the listed 20-day support is $281.15.
Technical Verdict: HOLD
HOLD (wait & see) reflects a mixed technical picture rather than a directional call. The share price is above both moving averages and MACD momentum is positive, but Stochastic is overbought, price sits near resistance, and latest-session volume is thin. The verdict is invalidated if the price falls below $281.15, the stated 20-day support.
- Ideal Entry Range: $294.50–$310.74, bounded by the 20-day and 50-day moving averages.
- Exit Target (Target Price): $315.11–$315.77, the stated resistance and upper Bollinger Band.
- Stop Loss protection: Below $281.15, the stated 20-day support.
In plain English, the indicators show a recent recovery, but the stock is close to resistance and needs clearer confirmation to establish whether the advance can continue.
Data table — Home Depot (NYSE: HD), as of Oct. 22, 2026, 03:00 WIB. Source: exchange data via Yahoo Finance.
Measure
Reading
Last price / previous close
$314.14 / $315.11
Change
1 day: -0.31%; 5 days: +6.30%; 1 month: +5.87%
Trend / moving averages
Sideways; SMA20 $294.50; SMA50 $310.74; no new crossover
Disclaimer: This technical analysis is generated automatically from exchange data (via Yahoo Finance) and indicators calculated by JournalArta, for information and education only. The verdict and the entry, target and stop-loss levels are not investment advice or a solicitation to buy or sell any security. Investment decisions and their risks rest solely with the reader.