HSBC Stock Technicals Today: Gains 1.96%, Testing Key Resistance
On September 7, 2026: price 166.70 HKD, trend sideways, RSI 63.9, support 160.30, resistance 166.70. technical analysis of hsbc stock. HSBC Stock Technicals —…
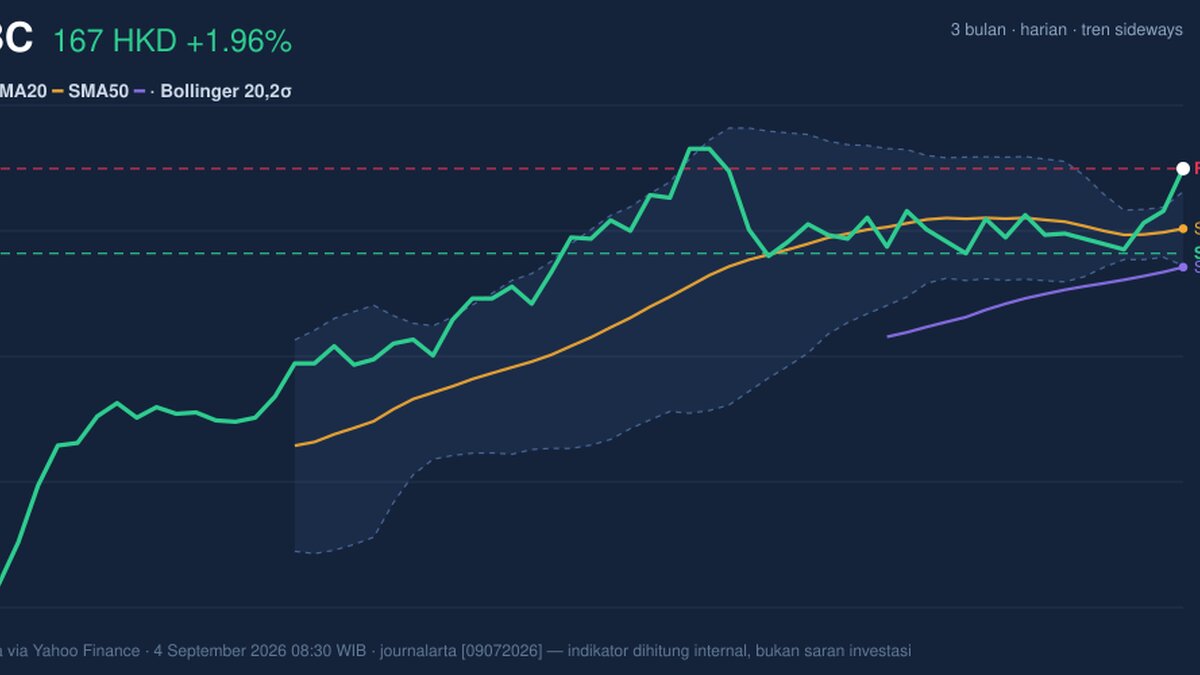
HSBC Holdings’ Hong Kong-listed shares closed at HKD 166.70, up 1.96% on the day, and the move pushed the stock back to the top of its short-term trading range, exactly where momentum traders start to notice whether a rally is gaining follow-through or simply running into resistance. The key signal is not just that the price rose; it is that it did so on 3.2× average volume, with OBV rising, which means the advance was backed by real participation rather than a thin, low-conviction bounce.
Trend & Price Action
The broader structure remains sideways, but the stock is trading above SMA20 at 162.17 and above SMA50 at 159.26, which tells readers the near-term bias has improved even though the longer pattern has not yet turned into a clean trend. The SMA20 slope of -0.11% over 5 days is a subtle warning: the short average is still easing lower, so the move higher is happening against a mildly soft backdrop rather than in a fully established uptrend. There is also no new MA cross, so the chart has not yet produced the cleaner signal that would confirm a new directional phase.
What stands out is positioning. With the last price at HKD 166.70, HSBC is sitting at the 100% end of its 20-hour range, right on the day’s ceiling as shown in the chart. That matters because price at the top of a range often acts like a test: either supply appears and caps the move, or the market accepts higher levels and forces a breakout. The 3-month high of 169.70 is the next obvious overhead reference, while 133.50 remains the lower anchor for the broader three-month band.
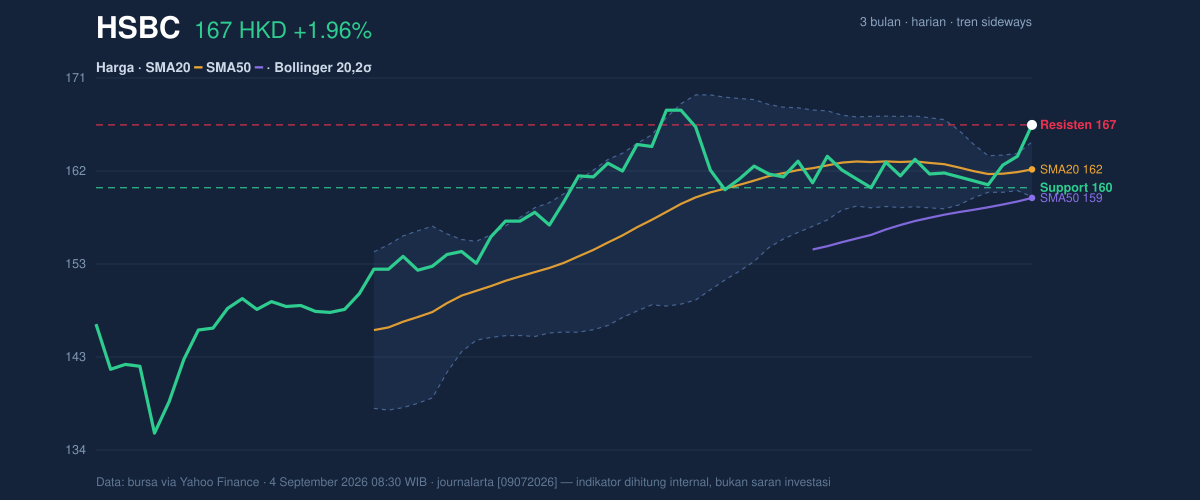
The Bollinger Bands reinforce that tension. Price is above the upper band at 164.96, and %B at 131% means the stock is trading beyond the band rather than merely inside it. In plain English, that usually signals a strong push, but it can also mean the move is stretched. The bands are also narrowing to 3.4%, a squeeze that often precedes a larger move. Put together, this is a classic pressure point: the stock is extended, yet the volatility setup suggests the next decisive move may be larger than the recent day-to-day drift.
Oscillators & Momentum
Momentum is mixed rather than uniformly bullish. The RSI at 63.9 is still in a neutral zone, which suggests the rally has room left before it enters the more crowded overbought area. But the Stochastic %K at 88.8 and %D at 79.2 are already overbought, meaning the stock has moved quickly enough that short-term traders may begin locking in gains if the price stalls. That is not an automatic reversal signal; it is a sign that the pace of ascent is getting ahead of itself.
The MACD tells a more constructive story. With MACD at 1.052 above the signal line at 0.979 and a positive histogram of 0.072, momentum remains positive and still has confirmation from trend-following logic. In practical terms, MACD is saying the price advance is still supported by the underlying direction of the move, even if the oscillators suggest the stock is no longer cheap on a very short horizon.
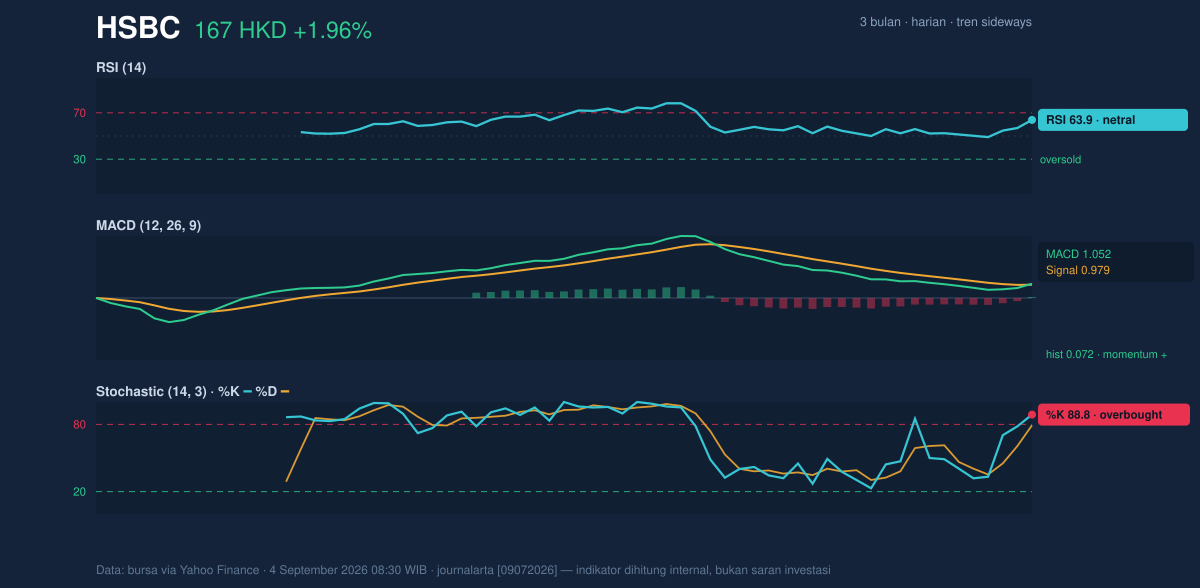
That combination is important: MACD positive, RSI neutral, but Stochastic overbought. It usually means the trend has not broken, yet the next leg needs fresh demand rather than just momentum carryover.
Volatility & Volume
Volatility remains contained, with ATR(14) at 2.39, or about 1.4% of price. Low ATR means the stock is not swinging wildly day to day, so when it does move, traders often pay attention to whether the move is being confirmed by volume or rejected quickly. Here, the volume spike matters: 30,851,316 shares traded versus a 20-hour average of 9,653,902, a clear burst of activity. That is the kind of participation that can help a stock push through a ceiling, especially when the Bollinger Bands are already compressed.
The message from volume and volatility is simple: the market is awake, but not yet fully committed to a direction. A squeeze plus heavy trading can be the prelude to continuation; it can also mark a temporary exhaustion point if the price cannot hold above the breakout area.
Key Levels & Scenarios
The immediate support is 160.30, which is also close to the SMA20 at 162.17 and the Bollinger middle band at 162.17. That cluster matters because it is the first zone where buyers have recently been willing to step in. If price falls back below that area, the short-term breakout attempt starts to lose credibility. On the upside, 166.70 is now the first reference point, but the more meaningful resistance to watch is the 3-month high at 169.70. A push through that level would signal that the stock is no longer just testing the top of the range.
The current setup is therefore less about a clean trend and more about an inflection. The stock is above both moving averages, volume confirms interest, and MACD is supportive. But the overbought Stochastic and the still-sideways trend mean the move needs confirmation, not celebration.
Technical Verdict: HOLD (wait & see)
HOLD (wait & see)
- MACD is positive and above its signal line, which supports the current upward push.
- Price is above SMA20 and SMA50, but the broader trend is still sideways and the SMA20 slope is slightly negative.
- Stochastic is overbought and price is already above the upper Bollinger Band, so the move is extended and needs confirmation.
Verdict invalidated if price falls below HKD 160.30.
- Ideal Entry Range: HKD 160.30 to 162.17
- Exit Target (Target Price): HKD 169.70
- Stop Loss protection: below HKD 159.38
For non-traders: the chart says HSBC is strong enough to watch, but not yet clean enough to assume the move will keep going.
Summary Data HSBC
| Last price | 166.70 HKD |
| Change 1 day / 5 days / 1 month | 1.96% / 3.28% / 3.41% |
| Trend / MA-cross | sideways / none |
| SMA20 / SMA50 | 162.17 / 159.26 |
| RSI (14) / Stochastic %K | 63.9 / 88.8 |
| Bollinger %B / ATR | 131% / 2.39 |
| Support / Resistance 20 days | 160.30 / 166.70 |
| Data as of | 4 September 2026 08:30 WIB |
Track HSBC share price daily: live levels, support/resistance and our full HSBC analysis history.