ORCL Testing Key Resistance: Stock Gains 3.08% (September 7, 2026)
On September 7, 2026: price 158.78 USD, trend uptrend, RSI 60.4, support 141.32, resistance 158.78. technical analysis of orcl stock. ORCL Testing Key…
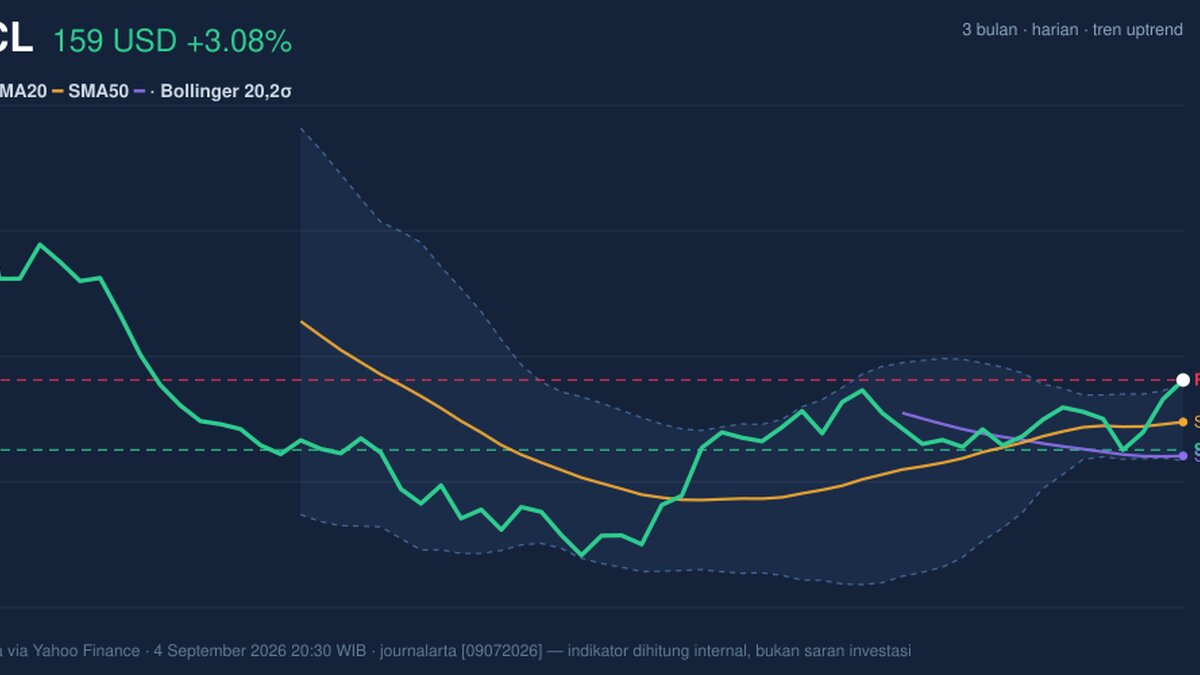
Oracle is trading at a fresh near-term extreme, with the stock pressing against resistance even as momentum remains constructive — a setup that can extend, but also one that often invites sharp pauses.
Oracle’s shares on the NYSE closed at 158.78 USD, up 3.08% on the day, according to Yahoo Finance data cited for 4 September 2026 20:30 WIB. That move lifted the stock above its SMA20 at 148.31 and well above its SMA50 at 139.84, a configuration that usually signals a market still rewarding recent strength rather than fading it. The broader trend remains uptrend, helped by a SMA20 slope of 0.90% over 5 days, which means the short-term average is still rising rather than flattening out. In plain language: buyers have been willing to pay up for the shares, and the trend is still leaning in their favor.
That said, the chart is also showing a stock that has run into the top of its short-term lane.
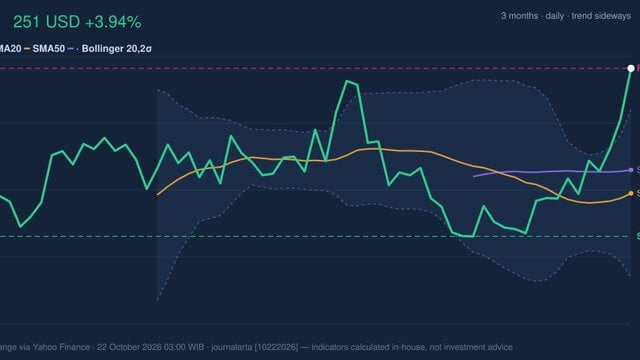
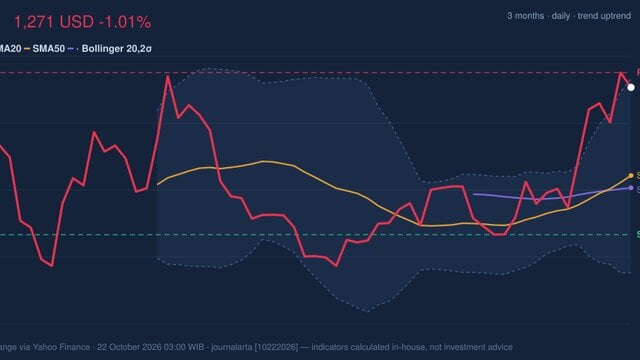
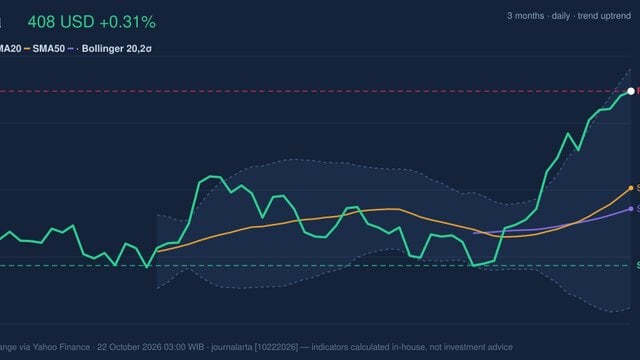
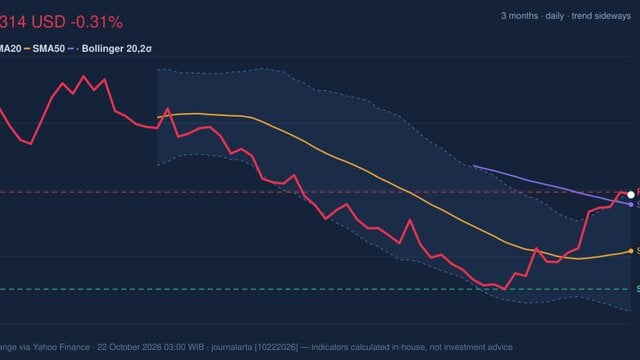
[ GRAFIK-HARGA ]
Trend & Price Action
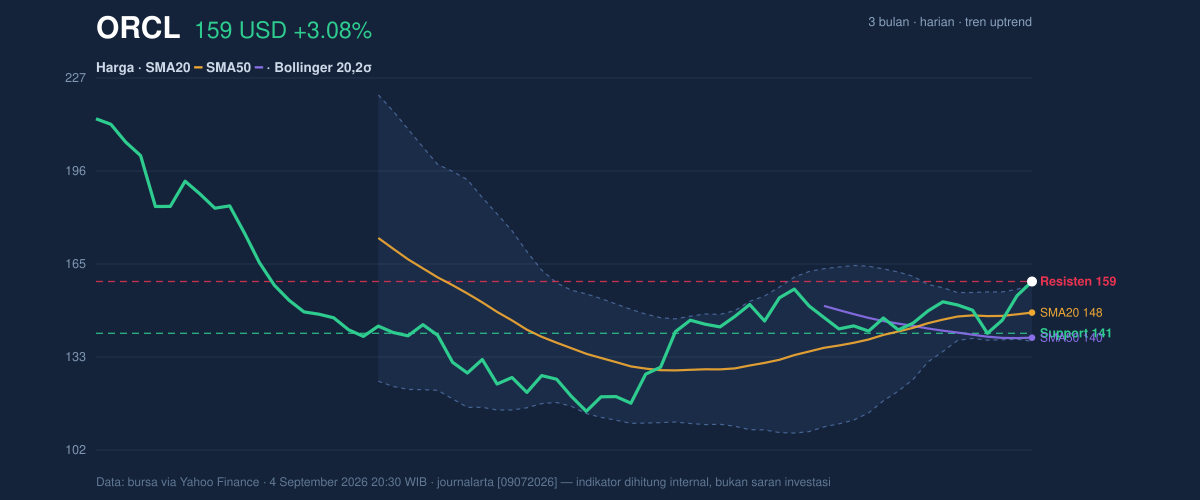
The price is sitting at 100% of the 20-hour range, with support at 141.32 and resistance at 158.78. When a stock trades at the top of its recent range, it tells readers two things at once: first, momentum is strong enough to push it to the ceiling; second, there is little room left before the market has to prove it can break higher or cool off. The 3-month high of 231.44 and 3-month low of 114.50 show that Oracle still sits well below its longer swing peak, but far above the lower end of that range. That matters because the stock is not in a panic rebound; it is in a sustained advance that has already repaired a large part of the earlier drawdown.
The Bollinger Bands reinforce that message. Oracle is trading above the upper band at 157.99, with %B at 104%, meaning price has moved beyond the top boundary of the band structure. That is not automatically bearish; it often reflects strength. But it does mean the move is extended relative to its recent average, and extended moves tend to be more sensitive to profit-taking. The Bollinger width of 13.1% is described as normal, so this is not a volatility squeeze waiting to explode. Instead, it suggests the market is already moving at a fairly ordinary pace, with the stock simply pushing to the upper edge of that range.
Volume confirms participation.
Volume was 26,430,100, about 1.2× normal versus the 20-hour average of 22,719,525, and OBV is rising. OBV, or on-balance volume, is a cumulative measure that rises when volume flows into up days and falls when it favors down days. A rising OBV alongside a price breakout attempt usually means the move has real participation behind it, not just thin trading.
Oscillators & Momentum
[ GRAFIK-MOMENTUM ]
The momentum picture is mixed, and that mix is important. RSI at 60.4 is neutral-to-firm, which means the stock is not yet in a classic overbought zone by RSI standards. RSI is a speed gauge: above 70 is often seen as stretched, below 30 as weak. At 60.4, Oracle still has room before that line is crossed. But the Stochastic %K at 95.9 and %D at 75.2 are overbought, which signals the stock is closing near the top of its recent range and may be vulnerable to a pause even if the trend remains intact. Stochastic tends to react faster than RSI, so it often flashes caution earlier.
The MACD at 2.423 remains above its signal line at 1.459, with a histogram of 0.964. That is a constructive reading because MACD is still confirming upward momentum rather than reversing it. Put simply, the trend engine is still running, even if the stock is getting a little stretched in the short run. The combination of positive MACD and overbought Stochastic often means the market is strong, but not necessarily cheap.
Key Levels & Scenarios
The immediate technical battlefield is tight. The stock’s resistance at 158.78 is now effectively the current price, so the next market question is whether Oracle can hold above that line on follow-through. If it does, the chart suggests the recent high zone may continue to act as a launch point rather than a ceiling. If it fails, traders will likely look first toward the SMA20 at 148.31, which also matches the Bollinger middle band at 148.31. That level is important because it represents the market’s short-term average; losing it would imply the latest push is losing momentum and reverting toward equilibrium.
Below that, the next structural reference is the support at 141.32. A drop through that area would be more serious because it would push price beneath the recent trading floor and closer to the SMA50 at 139.84. That would not erase the broader uptrend immediately, but it would weaken the message that buyers are still in control.
Oracle’s ATR(14) at 6.22, equal to 3.9% of price, also matters. ATR measures average daily movement, and this reading says the stock can swing more than many investors may expect in a single session. In practice, that means any break above resistance or slip back toward support can happen quickly.
Technical Verdict: HOLD (wait & see)
HOLD (wait & see)
- MACD remains positive, so the broader short-term momentum trend is still supportive.
- Price is above SMA20 and SMA50, which keeps the medium-term structure bullish.
- Stochastic is overbought and price is already at upper Bollinger-band territory, so the stock is extended and vulnerable to a pause.
Verdict invalidated if price falls below 141.32, because that would break the recent support floor and weaken the current uptrend structure.
- Ideal Entry Range: 148.31 to 141.32
- Exit Target: 157.99 to 158.78
- Stop Loss protection: below 139.84
For non-traders, this means Oracle still looks strong, but the chart is crowded near the top and needs a fresh push to justify more upside.
“The stock is strong, but at this level the market is asking for proof, not just momentum.”
Summary Data ORCL
| Last price | 158.78 USD |
| Change 1 day / 5 days / 1 month | 3.08% / 5.26% / 8.00% |
| Trend / MA-cross | uptrend / none |
| SMA20 / SMA50 | 148.31 / 139.84 |
| RSI (14) / Stochastic %K | 60.4 / 95.9 |
| Bollinger %B / ATR | 104% / 6.22 |
| Support / Resistance 20 days | 141.32 / 158.78 |
| Data as of | 4 September 2026 20:30 WIB |
Track ORCL stock price daily: live levels, support/resistance and our full ORCL analysis history.