Singtel Stock Gains 1.80% Today, Golden Cross Formed
On September 7, 2026: price 4.52 SGD, trend uptrend, RSI 57.3, support 4.25, resistance 4.54. technical analysis of singtel stock. Singtel Stock Gains — full…
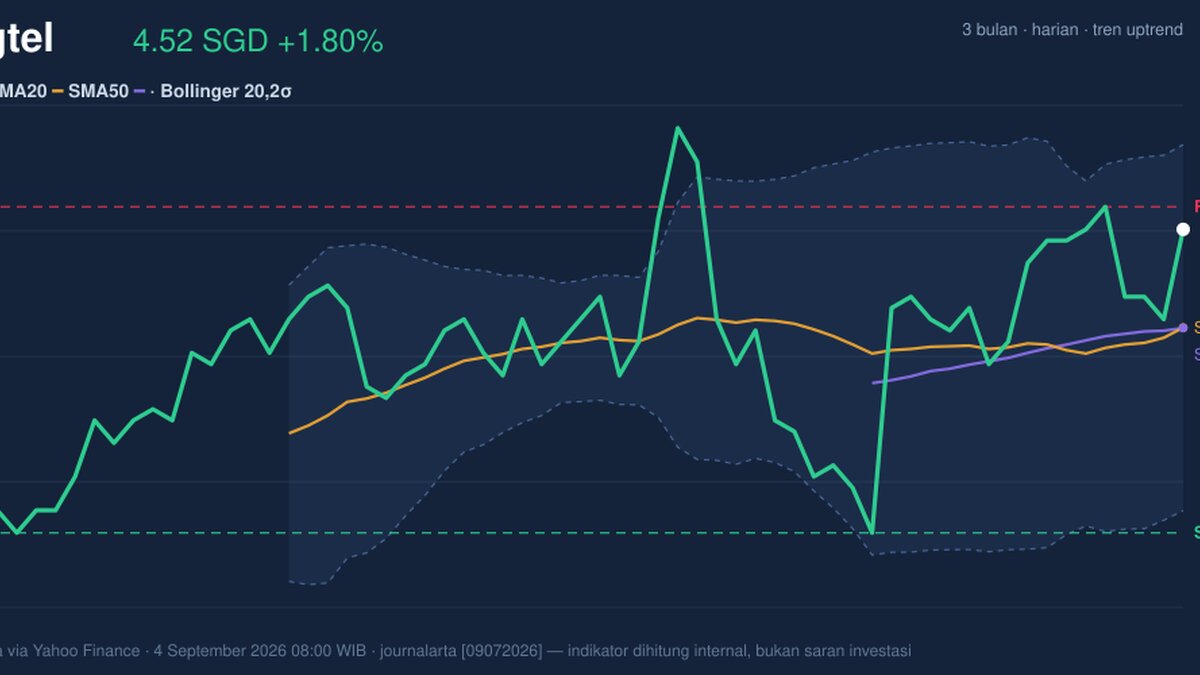
Singapore Telecom’s shares on SGX rose to 4.52 SGD on 4 September 2026, up from 4.44 at the previous close, as the stock pushed back toward its near-term ceiling in Singapore trading. The move matters because it comes with the price sitting above both short- and medium-term trend lines, while momentum remains positive but not stretched, a combination that often signals a market leaning higher without yet showing the kind of overheated conditions that tend to invite sharp reversals.
Trend & Price Action
Singtel is still trading in an uptrend, and the chart shows why: the share price is holding above SMA20 at 4.43 and SMA50 at 4.43, with a golden cross in place, meaning the faster average has moved above the slower one. That crossover is important because it tells traders the recent price path has improved enough to overtake the broader short-term trend, rather than merely bouncing for a day or two.
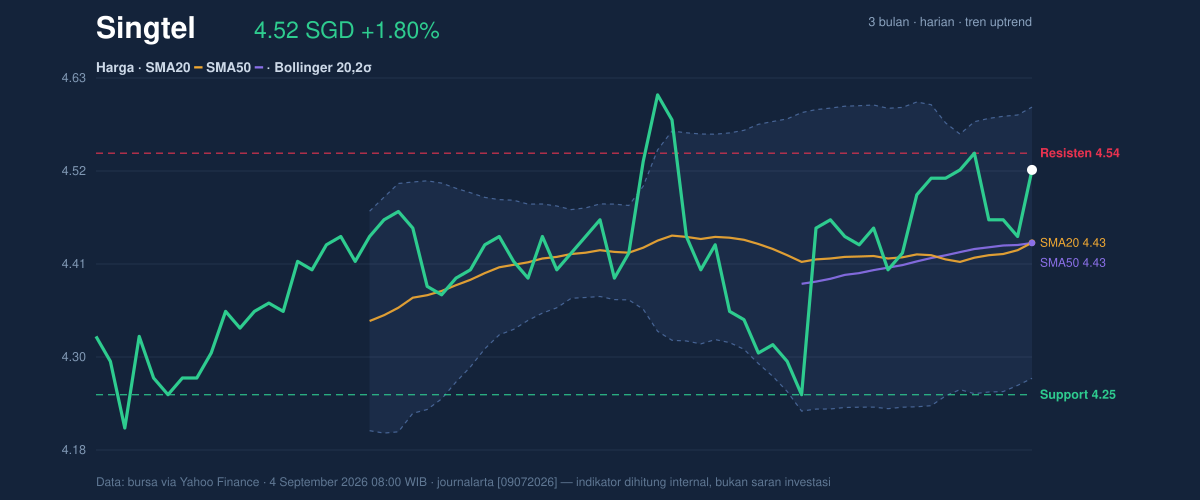
The stock is also trading near the upper end of its recent range, with support at 4.25 and resistance at 4.54, and the price is already at 93% of the range. That positioning suggests the market is testing supply rather than searching for a floor. In plain terms, buyers have done most of the work; the next move depends on whether the stock can absorb selling interest at the top of the band.
The broader context is constructive. Singtel’s 1-month gain of 4.15% sits alongside a 5-day flat reading of 0.00%, which implies the recent advance has paused rather than reversed. The stock is also below the 3-month high of 4.70 and above the 3-month low of 4.15, leaving room for continuation if the current consolidation resolves upward.
Oscillators & Momentum
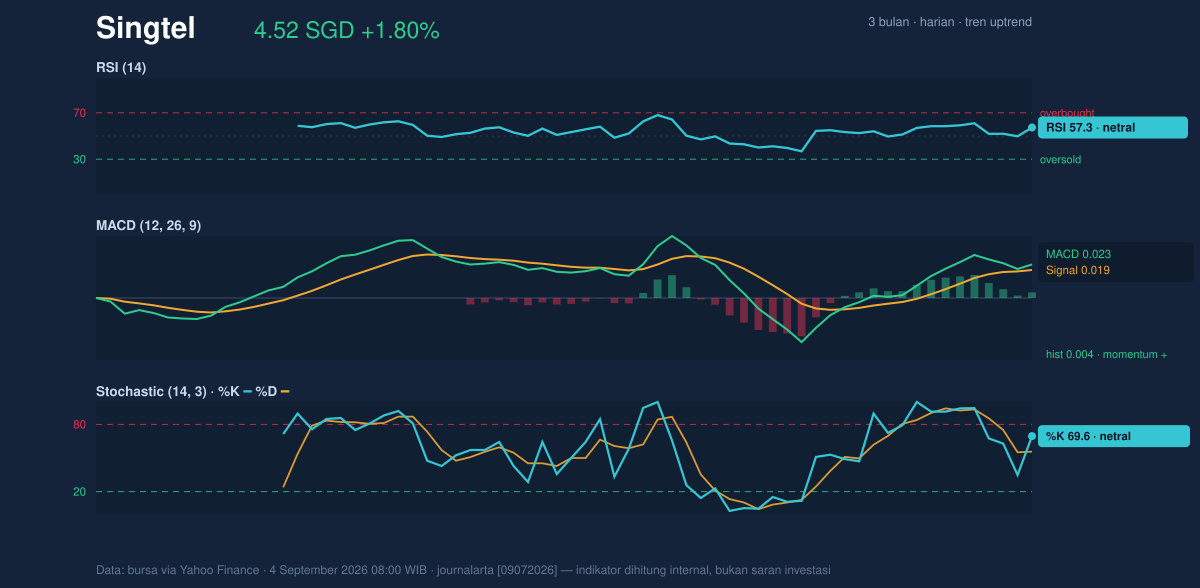
Momentum indicators are supportive, but not exuberant. The RSI at 57.3 is neutral, which means the stock is neither overbought nor oversold; that is often a healthy sign in an uptrend because it leaves room for further gains without forcing the market to unwind excess enthusiasm. The Stochastic %K at 69.6 and %D at 55.7 also sit in neutral territory, though the faster line is above the slower one, hinting that short-term buying pressure is still edging ahead of the recent average.
The more telling signal comes from MACD at 0.023 versus its signal line at 0.019, with a positive histogram of 0.004. That setup shows momentum is still tilted upward, because the faster trend measure remains above its trigger line. It is not a powerful surge, but it does confirm that the trend has not lost internal support.
Volatility & Volume
The Bollinger Bands add an important layer to the picture. With the upper band at 4.60, the middle band at 4.43, and the lower band at 4.27, the price is trading above the midline and below the ceiling, with %B at 77%. That means the stock is leaning toward the upper part of its volatility envelope, but it has not fully pressed into the extreme zone. Just as important, the 7.3% band width is described as a squeeze, which usually signals compressed volatility and the possibility of a sharper move once the range breaks.
That potential breakout, however, still needs participation. Volume came in at 17,742,226, below the 20-hour average of 25,554,645, or about 0.7× normal. In technical terms, that means the latest rise has not yet been backed by heavy turnover, so the move has not fully proven itself. The encouraging offset is that OBV is rising, which suggests accumulation may be building even if the latest session did not attract above-average activity. ATR at 0.07, or 1.6% of price, points to moderate volatility, so the stock is not currently in a whipsaw phase.
Key Levels & Scenarios
The immediate test is clear: 4.54 resistance is the first level that needs to give way before the chart can challenge the upper Bollinger band at 4.60. If that happens, the price would be moving out of the squeeze with confirmation from the trend structure, which could draw attention to the 3-month high at 4.70 as the next reference point.
If the stock fails to hold the current advance, the first meaningful cushion sits at 4.43, where both the SMA20 and SMA50 converge. That level matters because a break below a shared moving average often shifts the market from trend-following to range-trading. Below that, 4.27 is the lower Bollinger band and the next technical support marker, while 4.25 support is the nearby floor that has to hold to preserve the current setup.
Technical Verdict: HOLD (wait & see)
The chart is constructive, but not decisive enough to call it a clean breakout yet.
- Golden cross and price above SMA20/SMA50 at 4.43 keep the trend biased upward.
- MACD is positive and OBV is rising, which supports the idea that underlying demand is still present.
- Bollinger squeeze with %B at 77% shows compression near the top of the range, but volume at 0.7× normal means confirmation is still missing.
Verdict invalidated if price breaks below 4.25.
- Ideal Entry Range: 4.43 to 4.54
- Exit Target: 4.60 to 4.70
- Stop Loss Protection: 4.25
For non-traders: Singtel’s chart is leaning upward, but it still needs stronger volume to prove the move can extend beyond the current ceiling.
Summary Data Singtel
| Last price | 4.52 SGD |
| Change 1 day / 5 days / 1 month | 1.80% / 0.00% / 4.15% |
| Trend / MA-cross | uptrend / golden |
| SMA20 / SMA50 | 4.43 / 4.43 |
| RSI (14) / Stochastic %K | 57.3 / 69.6 |
| Bollinger %B / ATR | 77% / 0.07 |
| Support / Resistance 20 days | 4.25 / 4.54 |
| Data as of | 4 September 2026 08:00 WIB |
Track Singtel share price daily: live levels, support/resistance and our full Singtel analysis history.