Tencent Stock Analysis: Gains 2.26%, Death Cross Pressure
On September 7, 2026: price 442.80 HKD, trend downtrend, RSI 45.6, support 433.00, resistance 481.40. technical analysis of tencent stock.
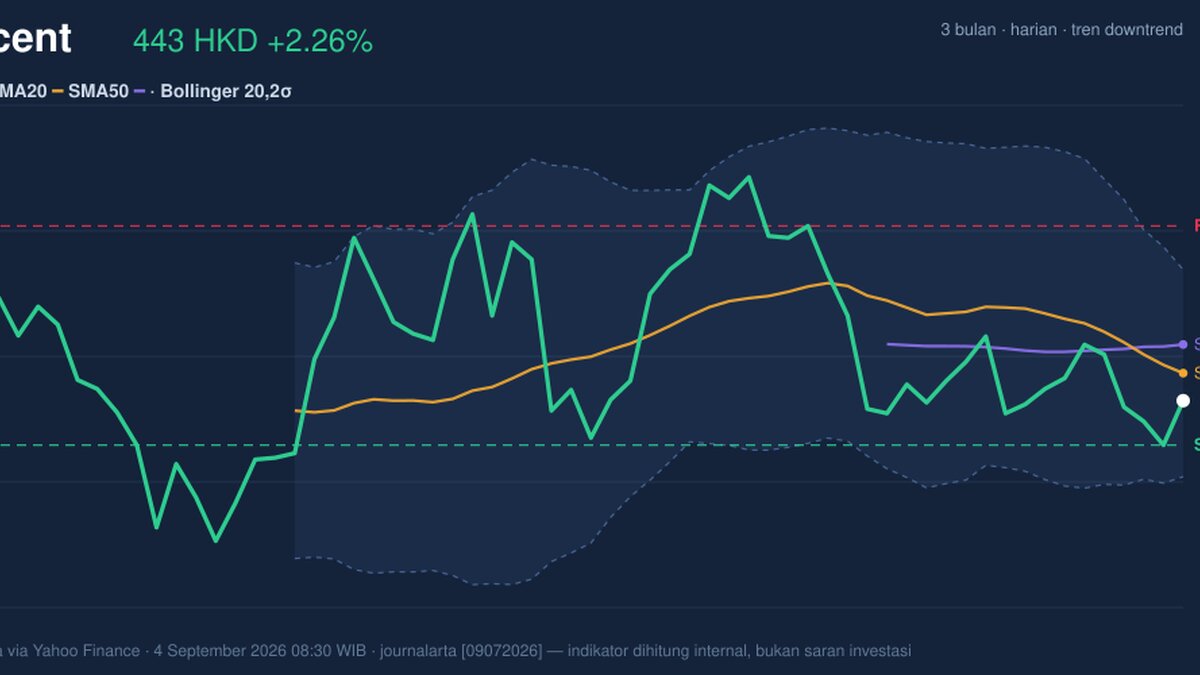
Tencent Holdings slipped to HK$442.80 on the Hong Kong market on 4 September, rebounding from the previous close of HK$433.00 but still trading below its short- and medium-term trend lines, according to exchange data via Yahoo Finance. The move matters less as a one-day bounce than as a test of whether buyers can reverse a pattern that has been weakening for weeks: the stock is down 2.72% over 5 days and 7.52% over 1 month, while the chart still points to a downtrend. In plain terms, Tencent is not in freefall, but it is still being sold on strength rather than being steadily accumulated.
Trend & Price Action
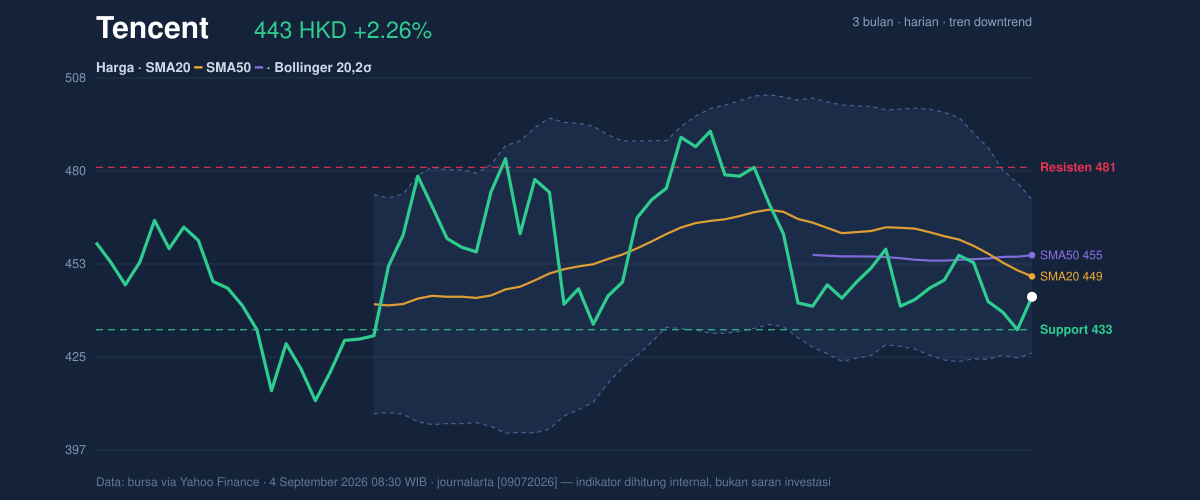
The key message from the moving averages is straightforward: Tencent remains under pressure. Price is sitting below the SMA20 at HK$448.90 and the SMA50 at HK$455.21, which tells traders the stock has not yet reclaimed either its short-term or intermediate trend. More importantly, the chart shows a death cross, where the 20-day average has crossed below the 50-day average. That crossover is often read as a sign that recent weakness has become persistent enough to drag the broader trend lower.
The slope of the SMA20 at -2.39% over 5 days reinforces that message. A falling average means each new session is, on balance, occurring at lower prices than the last. Tencent is also trading near the lower half of its recent range, with the last price roughly around the lower end of the 3-month band between HK$497.80 and HK$411.00. That places the stock closer to the area where buyers have previously emerged, but not yet in a confirmed reversal zone.
A bounce is visible. A trend change is not.
Oscillators & Momentum
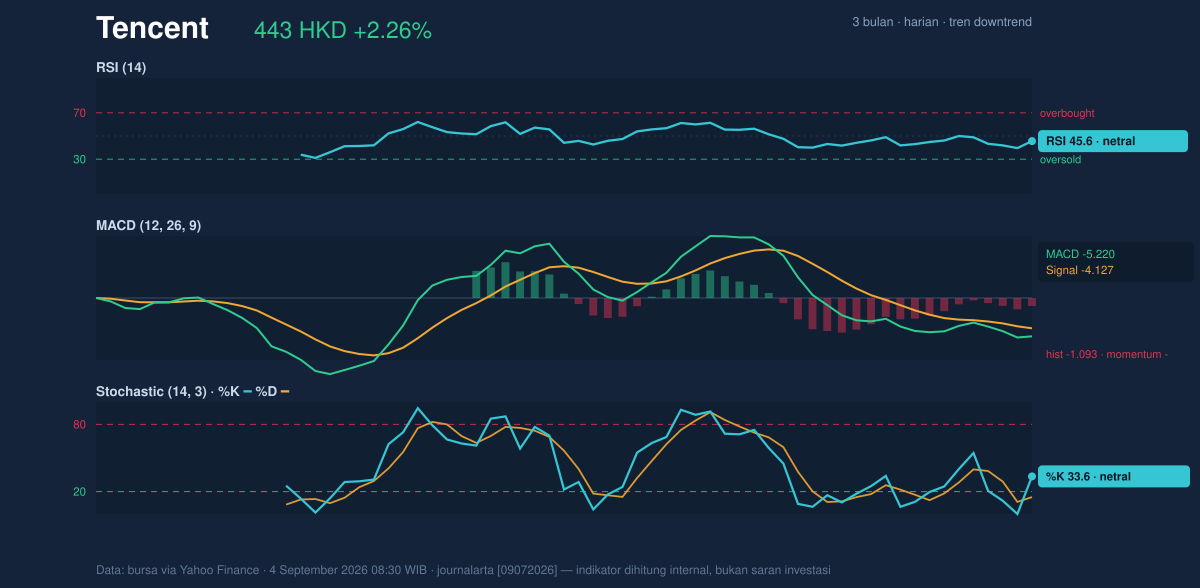
Momentum indicators are not shouting panic, but they are not yet confirming a durable recovery either. The RSI at 45.6 is neutral, which means Tencent is neither oversold nor overbought. In practical terms, that leaves room for either direction, but it also means the stock has not reached the kind of washed-out condition that often attracts stronger contrarian buying.
The Stochastic %K at 33.6 and %D at 15.1 also sit in neutral territory, though the low %D suggests momentum has been weak and recently compressed. That can sometimes precede a turn, but by itself it is not a reversal signal. The more important read comes from MACD at -5.220, below its signal line at -4.127, with a histogram of -1.093. That combination means downside momentum still leads upside momentum; the gap is not huge, but it is still negative.
In other words, the oscillators say Tencent is no longer stretched to the downside, yet the trend has not been repaired.
Volatility & Volume
Volatility is present, but not extreme. The ATR(14) at 11.21, equal to about 2.5% of price, suggests a session can still move meaningfully without looking disorderly. That matters because it defines how quickly the stock can travel between support and resistance once a direction is chosen.
Bollinger Bands show a market that is still coiled rather than broken. Price sits below the middle band at HK$448.90 but above the lower band at HK$426.01, with %B at 37%. That means Tencent is trading in the lower part of its recent volatility envelope, but not pressing the lower boundary. The band width of 10.2% is normal, so this is not a squeeze that typically precedes a dramatic expansion. It is more a steady, unresolved setup.
Volume adds an important nuance. The latest turnover of 24,025,286 was only about 1.0× the 20-session average of 23,187,338, which means the rebound did not arrive with a surge of conviction. On Balance Volume is still falling, and that is the clearest warning sign in the tape: price may have bounced, but participation has not yet turned decisively positive.
That is the difference between a reflex rally and a real base.
Key Levels & Scenarios
The nearest support is the HK$433.00 area, which also matches the previous close and sits close to the lower end of the recent range. If that level gives way, the chart opens toward the HK$426.01 Bollinger lower band and then the broader 3-month low zone near HK$411.00. On the upside, the first resistance to watch is HK$448.90, followed by the HK$455.21 area and then HK$481.40.
The current price sits around the lower part of the range, which means Tencent is at a decision point rather than a breakout point. A move back above the middle Bollinger band and the short-term averages would be the first sign that sellers are losing control; failure to hold support would say the opposite.
Technical Verdict: HOLD (wait & see)
HOLD (wait & see)
- The death cross and the SMA20 slope of -2.39% keep the trend negative.
- MACD remains below signal, showing downside momentum is still in control.
- RSI 45.6 and Stochastic 33.6 / 15.1 are neutral, so the stock is not oversold enough to argue for an aggressive reversal case.
- Verdict invalidated if price falls below HK$433.00, which would expose the lower Bollinger band at HK$426.01.
- Ideal Entry Range: HK$433.00 to HK$448.90
- Exit Target: HK$455.21 to HK$481.40
- Stop Loss Protection: below HK$426.01, with the broader risk area near HK$411.00
For non-traders, this means Tencent is drifting lower, but the chart is not weak enough to force a decision either way yet.
“It is still trying to prove that this bounce is more than a pause in the downtrend.”
Summary Data Tencent
| Last price | 442.80 HKD |
| Change 1 day / 5 days / 1 month | 2.26% / -2.72% / -7.52% |
| Trend / MA-cross | downtrend / death |
| SMA20 / SMA50 | 448.90 / 455.21 |
| RSI (14) / Stochastic %K | 45.6 / 33.6 |
| Bollinger %B / ATR | 37% / 11.21 |
| Support / Resistance 20 days | 433.00 / 481.40 |
| Data as of | 4 September 2026 08:30 WIB |
Track Tencent share price daily: live levels, support/resistance and our full Tencent analysis history.