Testing Key Resistance, DBS Stock Gains 0.90% Today
On September 7, 2026: price 78.65 SGD, trend uptrend, RSI 67.9, support 75.53, resistance 78.65. technical analysis of dbs stock. Testing Key Resistance — full…
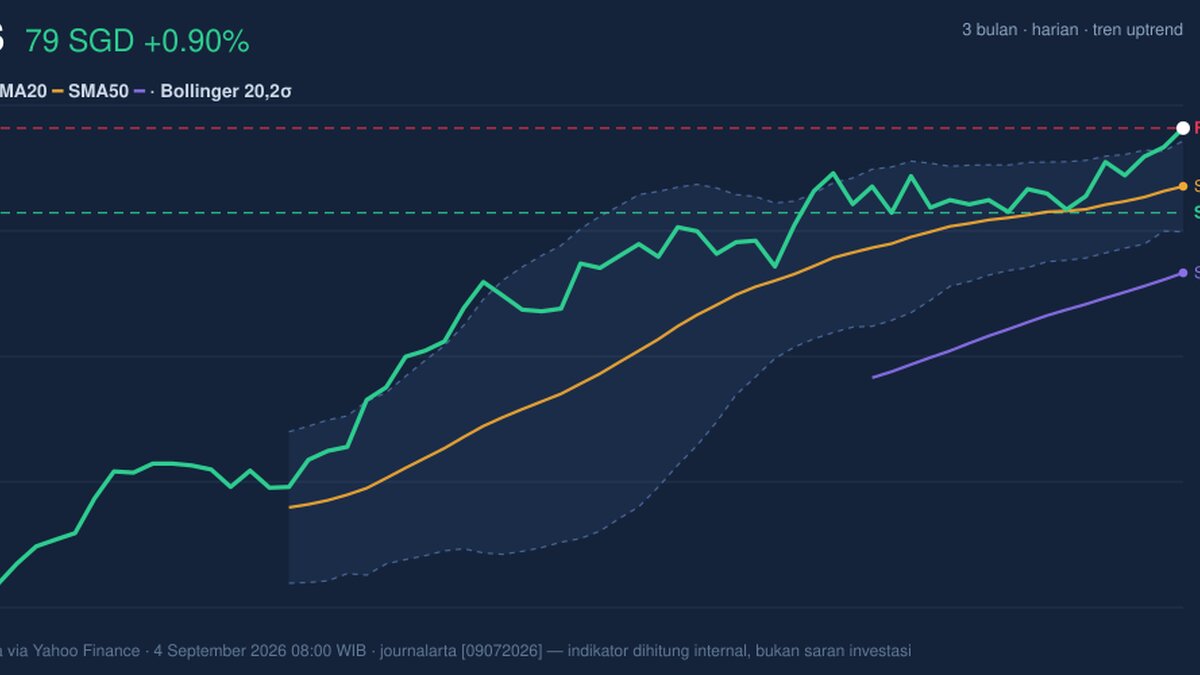
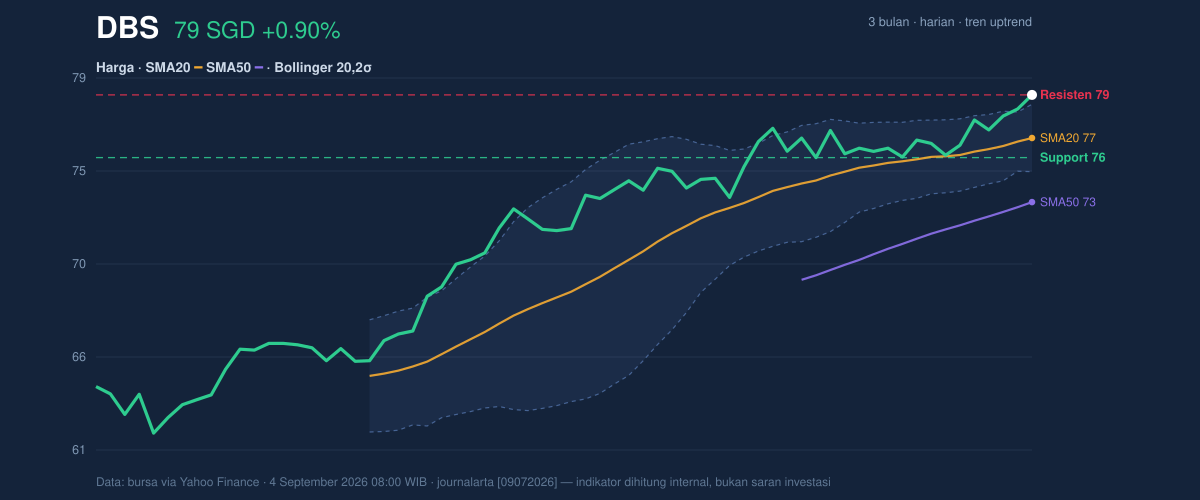
DBS Group’s shares rose to SGD 78.65 on 4 September 2026, up 0.90% from the previous close of SGD 77.95, and the move leaves the stock pressing against the top of its recent trading range, as shown in the chart. The message from the tape is straightforward: DBS is still in an uptrend, but it is now trading at a point where buyers have already done much of the work, and the next move depends on whether momentum can justify the stretch.
Trend & Price Action
The stock is sitting above its SMA20 at SGD 76.51 and well above the SMA50 at SGD 73.32, which is the basic shape of a healthy trend: short-term prices are leading medium-term prices, not lagging them. The SMA20 is also rising at 1.12% over 5 days, a sign that the recent advance is not just a one-day spike but part of a broader climb. There is no fresh MA-cross, so the chart does not show a new technical trigger from moving averages; instead, it shows an established trend that is still intact.
What stands out is where the price has landed. DBS is at 100% of its 20-hour range, with support at SGD 75.53 and resistance at SGD 78.65. In plain English, the stock is trading right at the ceiling of the short-term range, which often means the market is testing whether recent demand is strong enough to force a breakout or whether sellers will defend that level. The 3-month high at SGD 79.05 sits just above current price, so the stock is approaching a familiar barrier rather than entering open air.
That makes the next few sessions more about confirmation than direction.
Oscillators & Momentum
The momentum picture is mixed, and that matters because it explains why the stock can look strong while still being vulnerable to a pause. The RSI at 67.9 is described as neutral, but it is close enough to the overbought zone to suggest the rally is no longer early-stage. Meanwhile, the Stochastic %K at 89.9 and %D at 88.0 are both in overbought territory, which usually means the stock has been climbing faster than it has been cooling off. Overbought does not automatically mean a drop; it means the stock has become stretched and may need either a brief consolidation or a clean breakout to keep going.
The more constructive signal comes from MACD at 1.215 versus the signal line at 1.195, with a positive histogram of 0.021. That tells readers the trend’s internal momentum is still positive, even if it is not accelerating sharply. In other words, buyers still have the upper hand, but not by much. The chart is showing a market that is strong enough to stay elevated, yet mature enough that fresh volume or a decisive push may be needed to avoid stalling.
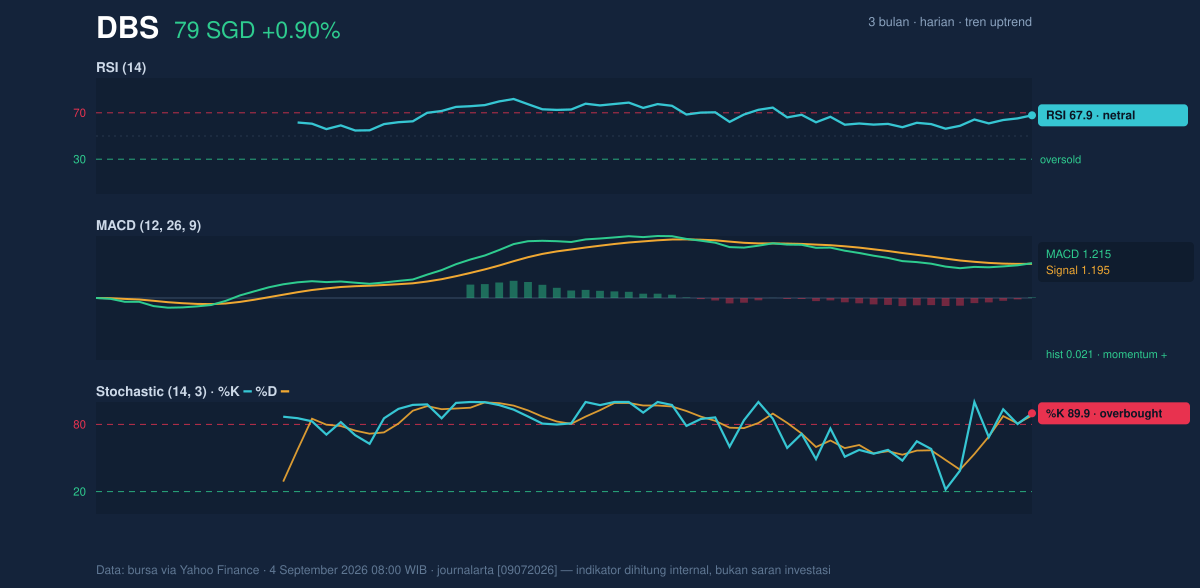
That tension between stretched oscillators and supportive trend signals is the key feature of the setup.
Volatility & Volume
Volatility is subdued for a name at this altitude. The ATR(14) of 1.01, equal to 1.3% of price, suggests daily swings are currently modest. Low ATR can be a sign of calm, but when it appears near the top of a range and alongside a narrowing Bollinger Band, it can also hint at compression before expansion. Here, the Bollinger Band width is just 4.4%, and the note that it is squeezing matters: compressed bands often precede a larger move, though the direction is not guaranteed.
The price is also sitting above the upper Bollinger band at SGD 78.18, with %B at 114%. That means DBS is trading beyond the top of its recent volatility envelope, a sign of strength, but also a sign that the move may be running ahead of its average pace. This is where context matters: a close above the upper band can reflect momentum, yet it can also mark short-term exhaustion if the market cannot build on it.
Volume offers partial confirmation, not full conviction. Last volume was 3,764,352, below the 20-session average of 4,176,720, or 0.9× normal. That tells us the latest advance was not powered by unusually heavy participation. Still, OBV is rising, which means the broader accumulation trend remains constructive even if today’s turnover was not exceptional. The signal is subtle but important: the market has been willing to absorb shares on balance, yet the latest push has not arrived with the kind of volume that usually turns a test into a statement.
Short version: strength is there, but the conviction is not loud.
Key Levels & Scenarios
The immediate technical map is clean. SGD 78.65 is the first level to watch because it is both the latest price and the short-term resistance marker. Above that, the next reference is the 3-month high at SGD 79.05. On the downside, SGD 76.51 marks the SMA20 and the Bollinger middle band, a zone that often acts like a balance point between momentum and mean reversion. Below that, SGD 75.53 is the nearest support from the 20-hour range, and a failure there would suggest the market is losing its grip on the recent advance.
If DBS can hold above the mid-band and convert SGD 78.65 into support, the chart would be signaling that the squeeze is resolving upward. If it slips back under SGD 76.51, the setup shifts from breakout attempt to range rotation. If SGD 75.53 breaks, the recent advance would look much less durable.
Technical Verdict: HOLD (wait & see)
HOLD (wait & see) — the trend is positive, but the stock is now stretched at the top of its short-term range, with Stochastic overbought and %B above 100% even as MACD remains positive and OBV is rising.
- Reason 1: Price is above SMA20 and SMA50, which keeps the broader trend constructive.
- Reason 2: MACD is still above the signal line, so momentum has not broken.
- Reason 3: Stochastic is overbought and price is above the upper Bollinger band, which raises the risk of a pause.
- Verdict invalidated if price falls below SGD 75.53, the nearest support from the 20-hour range.
- Ideal Entry Range: SGD 76.51 to 75.53
- Exit Target (Target Price): SGD 79.05
- Stop Loss protection: below SGD 75.53
For non-traders, this means DBS still looks technically healthy, but the share price is now close enough to resistance that the market needs to prove it can keep climbing. “It’s strong — but it has to earn the next step.”
Summary Data DBS
| Last price | 78.65 SGD |
| Change 1 day / 5 days / 1 month | 0.90% / 3.28% / 4.75% |
| Trend / MA-cross | uptrend / none |
| SMA20 / SMA50 | 76.51 / 73.32 |
| RSI (14) / Stochastic %K | 67.9 / 89.9 |
| Bollinger %B / ATR | 114% / 1.01 |
| Support / Resistance 20 days | 75.53 / 78.65 |
| Data as of | 4 September 2026 08:00 WIB |
Track DBS share price daily: live levels, support/resistance and our full DBS analysis history.