HD Stock Gains 0.94%, Death Cross Pressure In Focus
On September 8, 2026: price 321.05 USD, trend downtrend, RSI 38.2, support 318.07, resistance 354.48. technical analysis of hd stock. HD Stock Gains — full…
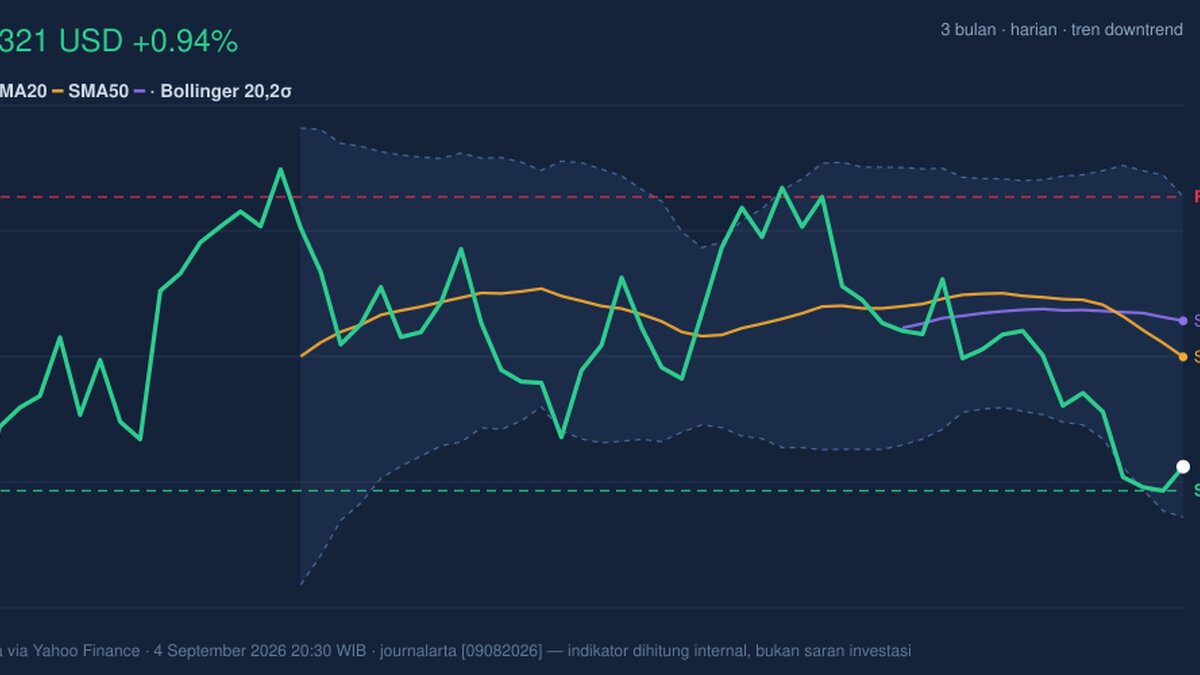
Home Depot shares were trading at 321.05 USD on the NYSE, up 0.94% from the previous close of 318.07, but the move sits inside a broader slide that has left the stock down 2.77% over 5 days and 9.72% over 1 month, according to Yahoo Finance data for 4 September 2026 20:30 WIB. That matters because a one-day bounce does not erase the market’s message: sellers still control the tape, and the stock is now trading below both its short- and medium-term trend markers, a sign that rallies are being treated more as relief than reversal.
Trend & Price Action
The price is below SMA20 at 334.66 and SMA50 at 339.12, while the chart also shows a death cross, where the 20-day average has moved under the 50-day average. In plain English, that crossover is a lagging but widely watched sign that recent selling pressure has become strong enough to overwhelm the earlier trend. The SMA20 slope of -2.07% over 5 days reinforces that message: the short-term average is still pointing lower, so the trend is not just weak, it is still deteriorating.
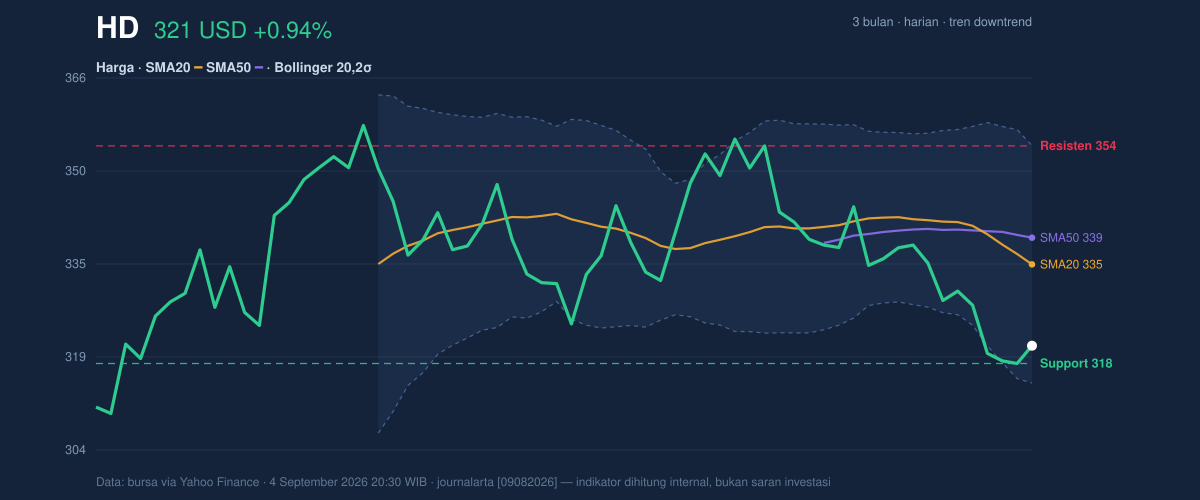
The stock is also sitting near the lower half of its recent trading band. With support at 318.07 and resistance at 354.48, the latest close is only about 8% up from support and far from the top of the range. That positioning tells us the market is testing whether the recent low can act as a floor, rather than proving a durable rebound. The broader 3-month range, from 307.07 to 358.85, shows the shares are moving closer to the lower end of that corridor.
A weak tape can still bounce. But it needs proof.
Oscillators & Momentum
Momentum indicators are mixed, but not in a way that currently favors the bulls. RSI at 38.2 is technically neutral, yet it sits below the midpoint of 50, which usually indicates that downside pressure still outweighs upside conviction. By contrast, the Stochastic %K at 16.6 and %D at 9.1 are in oversold territory, meaning the stock has been sold aggressively enough that a short-term rebound is possible. Oversold does not mean “cheap”; it means the market may be stretched enough for a pause or bounce.
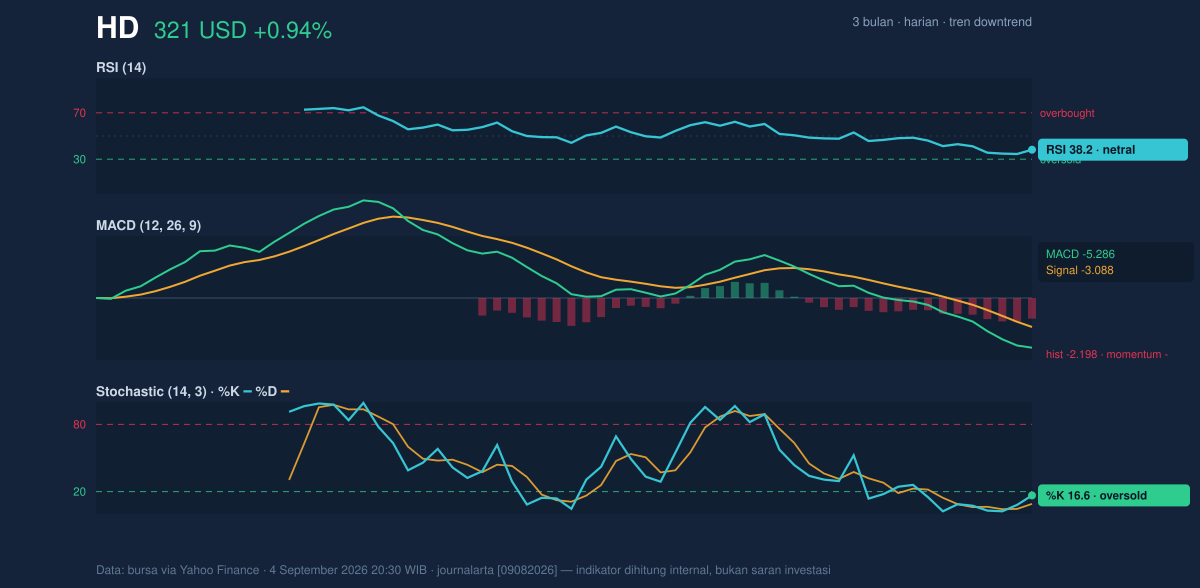
The problem is that the faster momentum tools are not confirming a genuine turn. MACD at -5.286, with the signal line at -3.088 and a histogram of -2.198, shows negative momentum is still expanding. For readers unfamiliar with MACD: when the line is below the signal and the histogram is negative, recent price action is still weaker than the longer trend, so the market has not yet built the kind of internal strength that usually marks a clean reversal. In other words, the stock may be oversold, but it is not yet repaired.
Volatility & Volume
The Bollinger Bands add another layer to the picture. Price is near the lower band at 314.79, with %B at 16%, which means the stock is trading close to the lower edge of its recent volatility envelope. That often happens when a share is under pressure and near a short-term exhaustion zone. Yet the band width is only 11.9%, described as normal, so this is not a dramatic volatility squeeze that typically precedes a sharp breakout. It is more a controlled drift lower than a coiled spring.
Volume is not helping the rebound case. The latest volume of 2,261,000 compares with a 20-day average of 3,644,240, or about 0.6× normal. That means the day’s advance did not come with strong participation, and the falling OBV — on-balance volume, a measure that tracks whether volume is building behind up days or down days — suggests distribution still outweighs accumulation. When price rises on weak volume and OBV keeps falling, the market is saying buyers are present, but not yet committed.
The good news is that volatility is manageable. The ATR of 7.34, or 2.3% of price, implies the stock can move, but not in a disorderly way. That makes nearby levels especially important.
Key Levels & Scenarios
The immediate line in the sand is 318.07, which is both the 20-hour support and the previous close. If that level fails, the stock would be moving back toward the lower end of its 3-month range at 307.07. On the upside, 334.66 is the first technical hurdle because it marks the middle Bollinger band and the SMA20; above that, 339.12 becomes the next checkpoint, followed by 354.48 to 354.53, where resistance and the upper Bollinger band converge.
What makes these levels important is not just their location, but their role in sentiment. A move back above the moving averages would tell the market that recent selling has been absorbed and that the death cross may be losing force. Failure to reclaim them would keep the stock in a corrective phase, with rallies likely to meet supply.
Technical Verdict: HOLD (wait & see)
HOLD (wait & see)
- MACD remains negative, so downside momentum has not fully faded.
- Price is below SMA20 and SMA50, and the death cross still confirms a bearish trend structure.
- Stochastic is oversold and price is near lower-band support, which argues against chasing weakness or assuming a clean breakdown without confirmation.
Verdict invalidated if price breaks 354.48 on a sustained basis, because that would mean the stock has reclaimed the upper range and challenged the current bearish structure.
- Ideal Entry Range: 318.07 to 314.79
- Exit Target: 334.66 to 339.12
- Stop Loss Protection: below 307.07
For non-traders: the stock is weak, but it is also close to levels where a bounce can happen, so the chart is asking for confirmation rather than urgency.
Summary Data HD
| Last price | 321.05 USD |
| Change 1 day / 5 days / 1 month | 0.94% / -2.77% / -9.72% |
| Trend / MA-cross | downtrend / death |
| SMA20 / SMA50 | 334.66 / 339.12 |
| RSI (14) / Stochastic %K | 38.2 / 16.6 |
| Bollinger %B / ATR | 16% / 7.34 |
| Support / Resistance 20 days | 318.07 / 354.48 |
| Data as of | 4 September 2026 20:30 WIB |
Track HD stock price daily: live levels, support/resistance and our full HD analysis history.



