AIA Stock Analysis: Drops 0.26%, Testing Key Resistance
On September 9, 2026: price 76.90 HKD, trend sideways, RSI 57.9, support 70.40, resistance 77.50. technical analysis of aia stock. AIA Stock Analysis — full…
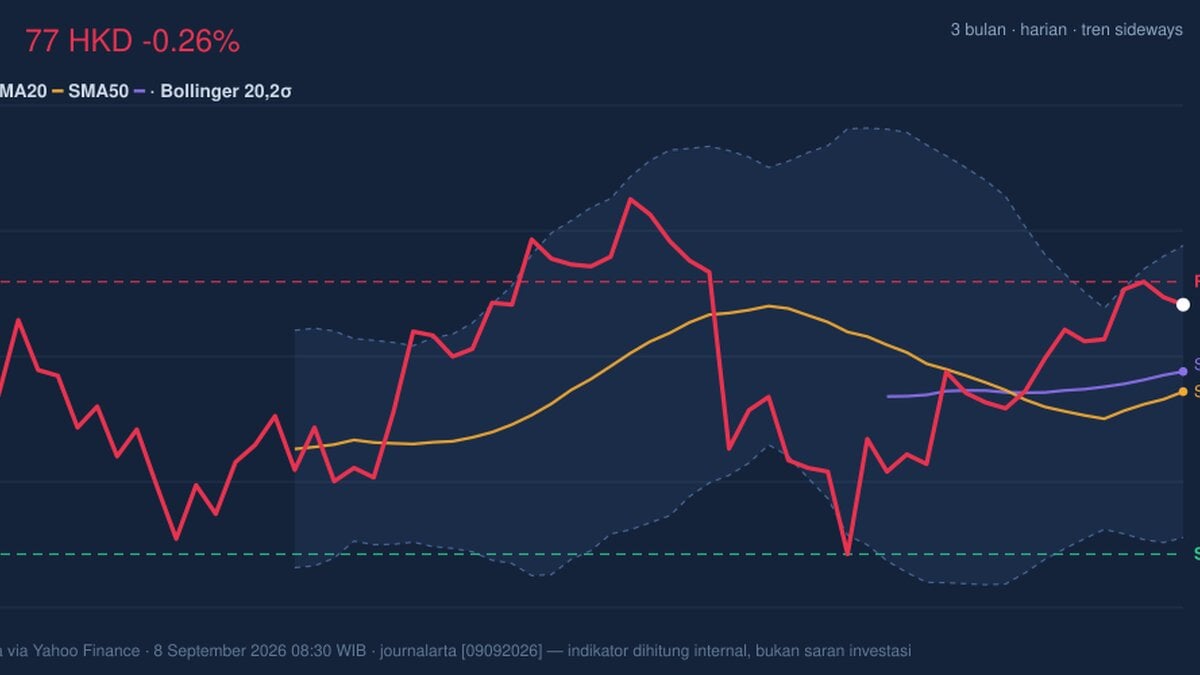
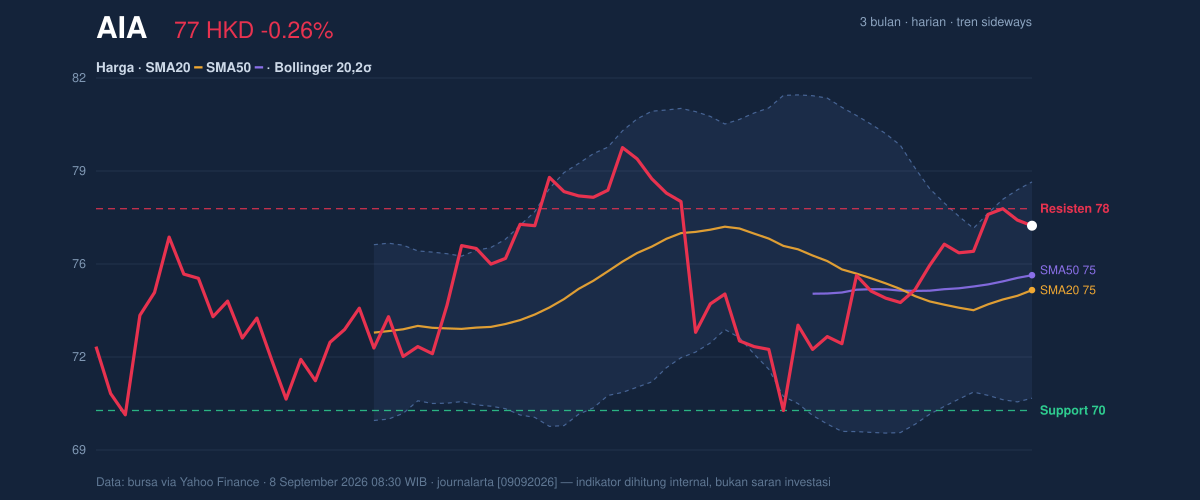
AIA Group ended at 76.90 HKD, down 0.26% from the previous close of 77.10, but the more important signal is that the share price is still holding above both its SMA20 at 74.64 and SMA50 at 75.16. That keeps the stock in a short-term constructive posture even though the broader pattern remains sideways, with the 20-day average still rising at 0.84% over five days. In plain terms, the chart is not showing a breakout trend yet, but it is also not showing the kind of deterioration that typically precedes a sharper slide.
Trend & Price Action
As shown in the chart, AIA is trading in the upper part of its recent range, at 92% of the 20-day support-resistance band between 70.40 and 77.50. That matters because price near the top of a range usually means traders are testing whether the ceiling can become a new floor. The stock is also sitting below the 3-month high of 80.15 and well above the 3-month low of 69.05, which frames the current move as recovery within a range rather than a fresh trend expansion.
Resistance at 77.50 is now the key short-term barrier. A clean move through that level would signal that recent buying pressure is strong enough to absorb supply near the top of the band. On the other hand, failure to clear it could keep AIA trapped in sideways trade, especially since there has been no new MA-cross to confirm a stronger directional shift. The absence of a fresh moving-average crossover is important: it suggests the market has not yet chosen a dominant trend, even though price is holding above the shorter averages.
Oscillators & Momentum
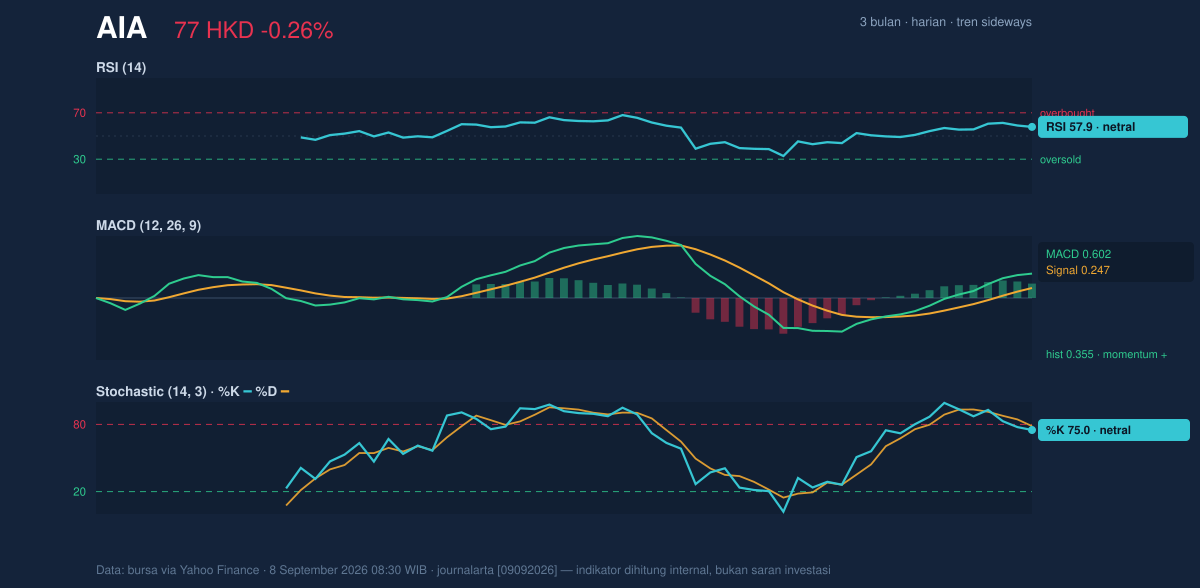
The momentum picture is firmer than the price action alone might suggest. The RSI at 57.9 is neutral, which means the stock is neither stretched nor washed out. That is a healthy reading in a range-bound market because it leaves room for further upside without flashing an overbought warning. The Stochastic %K at 75.0 and %D at 78.5 are also neutral, but they are sitting near the upper end of the scale, which tells readers that short-term momentum is improving while approaching a zone where traders often become more selective.
The stronger signal comes from the MACD at 0.602, above its signal line at 0.247, with a histogram of 0.355. In technical terms, that means the faster-moving average is still ahead of the slower one, and the gap is positive. For general readers, this is a sign that upward momentum has not disappeared even if the stock paused on the day. It is not a runaway trend signal, but it is a constructive confirmation that the recent rebound still has some internal strength.
Volatility & Volume
The Bollinger Bands offer another useful clue. Price is trading near the upper half of the band structure, with %B at 80%, which means the share is closer to the upper band at 78.44 than to the middle band at 74.64. That position often reflects a market leaning upward, but not yet in a stretched condition severe enough to imply immediate exhaustion. The band width at 10.2% is described as normal, so there is no squeeze suggesting an imminent volatility burst, and no expansion implying a dramatic breakout is already underway.
ATR at 1.74, or 2.3% of price, points to moderate day-to-day movement. That helps explain why the stock can drift higher without producing dramatic candles. It also means any attempt to break resistance may need steady participation rather than a single sharp session. Volume, however, remains the softer part of the story. The latest turnover of 12,963,982 was only 0.5× the 20-session average of 28,225,809, which signals a quiet session rather than broad conviction. Even so, OBV is rising, and that is an important counterweight: on-balance volume suggests the cumulative flow of shares has been improving even when the current day’s trading was thin. In other words, the market’s longer-running participation trend is better than the latest tape might imply.
Key Levels & Scenarios
Support at 70.40 is the level that matters if sentiment weakens. It sits above the 3-month low of 69.05, so a break below support would raise the risk that the stock returns to the lower part of its range. On the upside, 77.50 resistance is the trigger level to watch. A move above it would place the stock in the space between the current range ceiling and the 3-month high of 80.15, where momentum traders often look for follow-through.
The positioning is therefore fairly clear: price is near the top of the recent band, momentum is positive but not overheated, and volume has not yet confirmed a decisive expansion. That combination usually points to a market waiting for a catalyst. The chart shows enough support from moving averages and MACD to avoid a bearish reading, but not enough breakout evidence to call it strong trend acceleration.
Technical Verdict: HOLD (wait & see)
HOLD (wait & see) because price is above SMA20 and SMA50, MACD remains positive, and RSI/Stochastic are neutral rather than overbought. The setup is constructive, but volume is only 0.5× average and there is no new MA-cross, so the chart lacks confirmation of a clean breakout. This verdict is invalidated if price falls below 70.40.
- Ideal Entry Range: 74.64 to 75.16, near the SMA20/SMA50 zone where pullbacks have support.
- Exit Target: 77.50, with 80.15 as the next chart reference if resistance gives way.
- Stop Loss Protection: 70.40, below the 20-day support and above the 3-month low of 69.05.
For non-traders, this means the shares are steady and technically healthier than weak, but they still need stronger participation before the move can be called decisive.
Summary Data AIA
| Last price | 76.90 HKD |
| Change 1 day / 5 days / 1 month | -0.26% / 1.25% / 5.56% |
| Trend / MA-cross | sideways / none |
| SMA20 / SMA50 | 74.64 / 75.16 |
| RSI (14) / Stochastic %K | 57.9 / 75.0 |
| Bollinger %B / ATR | 80% / 1.74 |
| Support / Resistance 20 days | 70.40 / 77.50 |
| Data as of | 8 September 2026 08:30 WIB |
Track AIA share price daily: live levels, support/resistance and our full AIA analysis history.



