AMD Stock Gains 5.90%, Momentum Gains In Focus
On September 9, 2026: price 505.74 USD, trend sideways, RSI 57.1, support 456.16, resistance 514.39. technical analysis of amd stock. AMD Stock Gains — full…
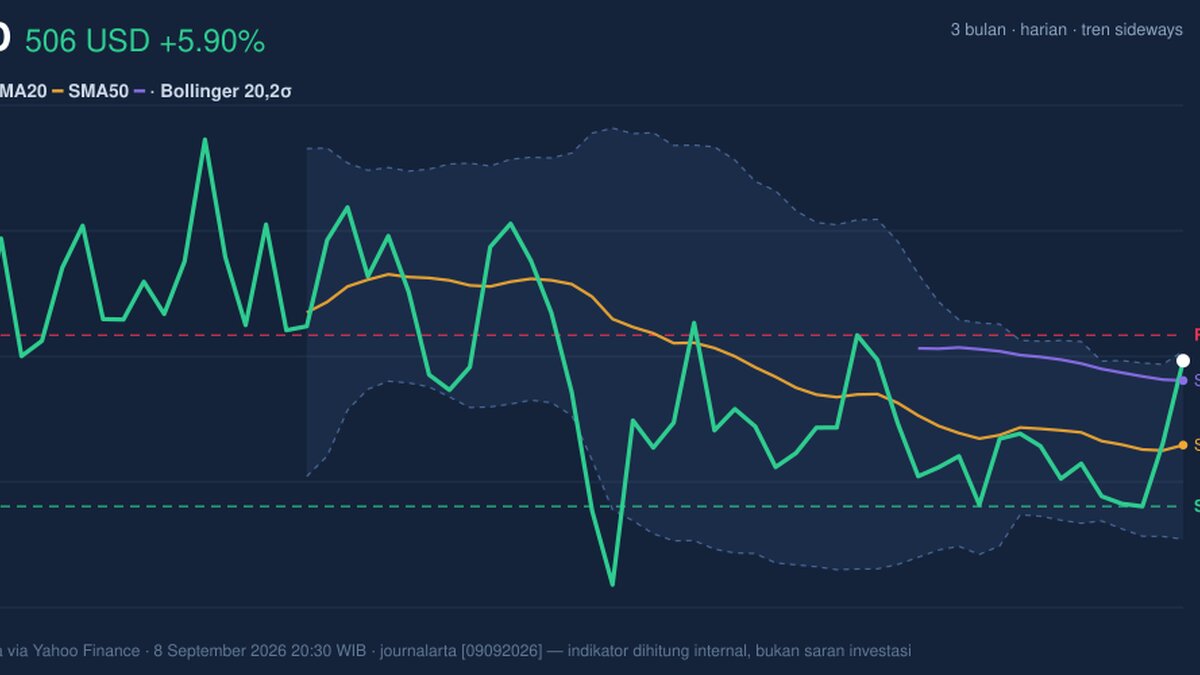
AMD is pressing into the upper end of its recent range, but the chart is now flashing a mix of strength and stretch that often matters more for international investors than the headline gain itself.
Advanced Micro Devices closed at 505.74 USD on Nasdaq, up 5.90% on the day and extending its 1 month advance to 7.71%, according to market data cited via Yahoo Finance. The move lifted the shares above the short-term average, yet the broader message from the chart is not simple momentum; it is a stock trying to hold a recovery while approaching a ceiling that traders have already mapped out.
Trend & Price Action
The first signal is that AMD remains in a sideways trend, even after the latest jump. That matters because a sideways market is not the same as a clean uptrend: it means price is still moving inside a range rather than breaking into a sustained directional phase. The SMA20 at 477.01 is below the current price, which shows near-term improvement, while the SMA50 at 498.96 has also been reclaimed. That combination usually tells readers that buyers have regained control of the short and medium horizon, but not decisively enough to call a fresh trend change.
There is no new MA-cross, so the chart does not yet show the kind of moving-average crossover that often confirms a stronger regime shift. The SMA20 slope of -0.90% over 5 days is also a warning that the short average is still leaning lower, even if price has pushed above it. In plain language, the stock is climbing faster than its average, but the average itself has not fully turned up. That is often what a late-stage rebound looks like.
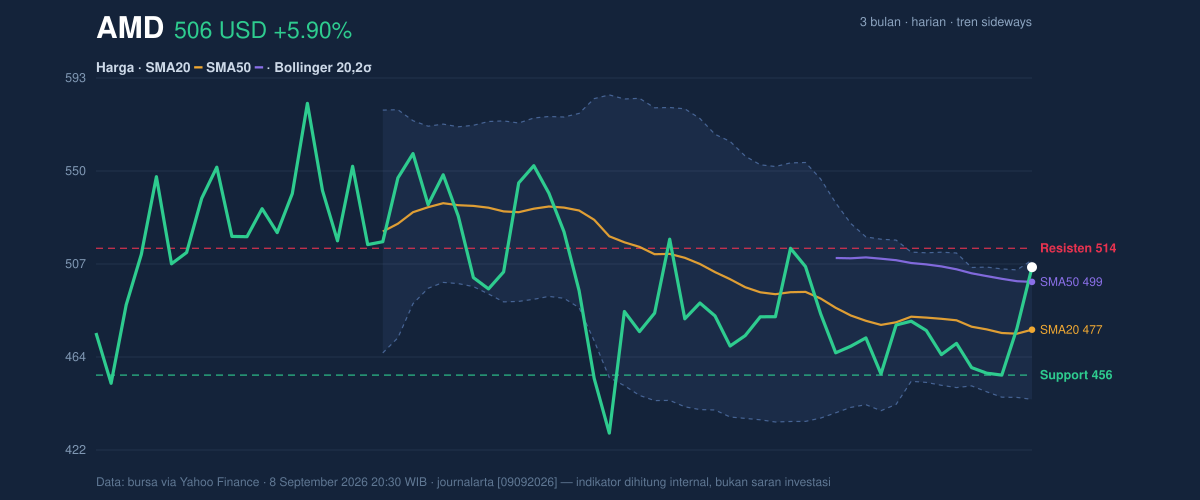
The share price is sitting at about 85% of its 20-hour range, with support at 456.16 and resistance at 514.39. It is also trading just under the upper Bollinger band at 508.99, as shown in the chart. That positioning means AMD is close to the top of its recent corridor, not in the middle of it. For readers, that usually implies less room for easy continuation unless volume keeps expanding.
Oscillators & Momentum
The momentum picture is more mixed than the price action alone suggests. RSI at 57.1 is neutral, which means the stock is not yet overbought on a broader momentum basis. But the Stochastic %K at 90.8 versus %D at 61.1 is a classic overbought reading. Stochastic often reacts faster than RSI, so this tells us the recent push has been sharp and may be running ahead of itself in the very short term.
The MACD at -4.938 sits below the zero line, while the signal line at -7.908 is lower still and the histogram at 2.970 is positive. That structure matters. It says bearish momentum is still present in the background, but the gap between MACD and signal has narrowed enough to show improving internal momentum. In other words, the stock is not in a clean bullish trend yet, but the direction of change has improved.
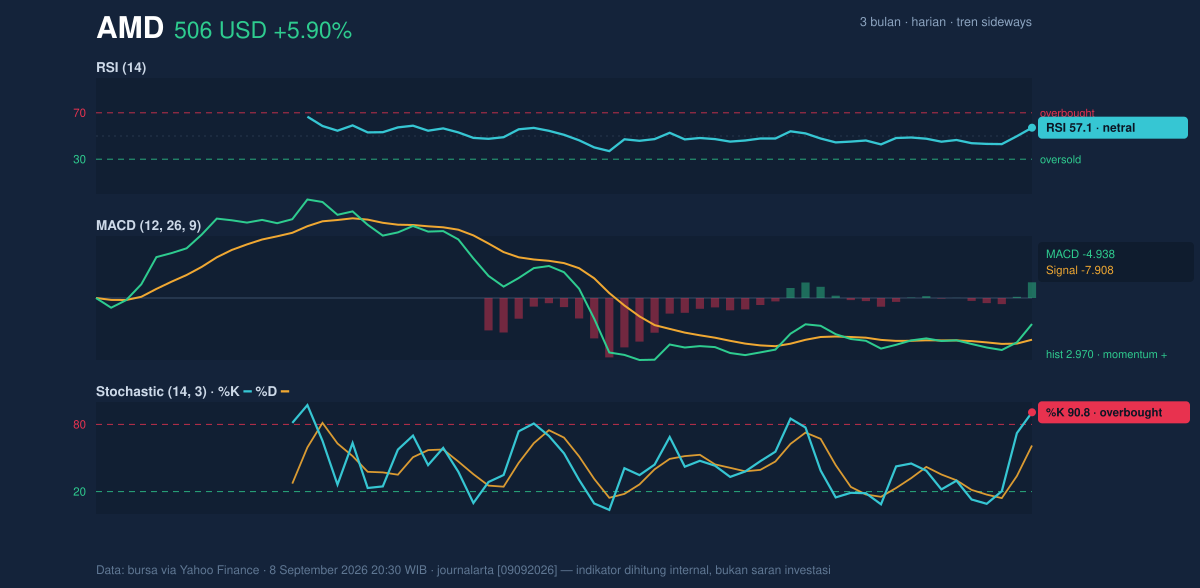
Taken together, the oscillators argue for caution rather than euphoria. RSI is neutral, Stochastic is overbought, and MACD momentum is positive but still below zero. That mix often appears when a stock is strong enough to keep rising, but not strong enough to do so smoothly.
Volatility & Volume
Volatility is not quiet here. ATR(14) at 18.75, or 3.7% of price, signals elevated daily movement. For non-specialists, ATR is a measure of how far a stock typically swings; a higher reading means wider intraday and day-to-day ranges are normal. That makes AMD more vulnerable to sharp reversals if buyers hesitate near resistance.
The Bollinger setup adds another layer. The band width is 13.4%, described as normal, so this is not a squeeze waiting to explode, but the price is already near the upper edge with %B at 95%. A %B reading that high means the stock is trading very close to the top of its recent volatility envelope. That often reflects strength, but it also means the move has already consumed much of the easy upside inside the current band.
Volume confirms participation rather than exhaustion. Last volume was 28,125,200, about 1.6× the 20-hour average of 17,929,015, and OBV is rising. OBV, or on-balance volume, tracks whether volume flows are supporting price direction. A rising OBV alongside a price advance is generally constructive because it suggests the move is being backed by real participation, not just thin trading.
Key Levels & Scenarios
The nearest technical ceiling is 514.39, with the Bollinger top at 508.99 already close by. That creates a tight test zone. If AMD can hold above 498.96 and then clear 514.39, the chart would begin to look less like a rebound and more like a range expansion. If it fails there, the more important support sits at 477.01, then 456.16. Below that, the broader 3-month floor is 424.03, while the 3-month high at 584.73 marks the upper boundary of the larger swing.
Technical Verdict: HOLD (wait & see)
HOLD (wait & see)
- Reason 1: Price is above SMA20 and SMA50, but the market is still labeled sideways and there is no new MA-cross.
- Reason 2: Stochastic is overbought and price is near the upper Bollinger band, which raises the risk of a pause or pullback.
- Reason 3: MACD histogram is positive and volume is 1.6× average, so the move has support, but not yet enough confirmation to remove caution.
- Verdict invalidated if price falls below 477.01, which would put AMD back under the short-term average and weaken the current recovery structure.
- Ideal Entry Range: 477.01 to 498.96
- Exit Target (Target Price): 514.39
- Stop Loss protection: 456.16
For readers who do not trade charts every day: AMD is stronger than it was, but it is now close to a level where the market has to prove the move is real rather than just fast. “The next move will tell us whether this is a breakout or just a very energetic pause.”
Summary Data AMD
| Last price | 505.74 USD |
| Change 1 day / 5 days / 1 month | 5.90% / 7.44% / 7.71% |
| Trend / MA-cross | sideways / none |
| SMA20 / SMA50 | 477.01 / 498.96 |
| RSI (14) / Stochastic %K | 57.1 / 90.8 |
| Bollinger %B / ATR | 95% / 18.75 |
| Support / Resistance 20 days | 456.16 / 514.39 |
| Data as of | 8 September 2026 20:30 WIB |
Track AMD stock price daily: live levels, support/resistance and our full AMD analysis history.



