BP Stock Technicals Today: Gains 1.93%, Testing Key Resistance
On September 9, 2026: price 550.10 GBp, trend uptrend, RSI 57.5, support 514.50, resistance 552.20. technical analysis of bp stock. BP Stock Technicals — full…
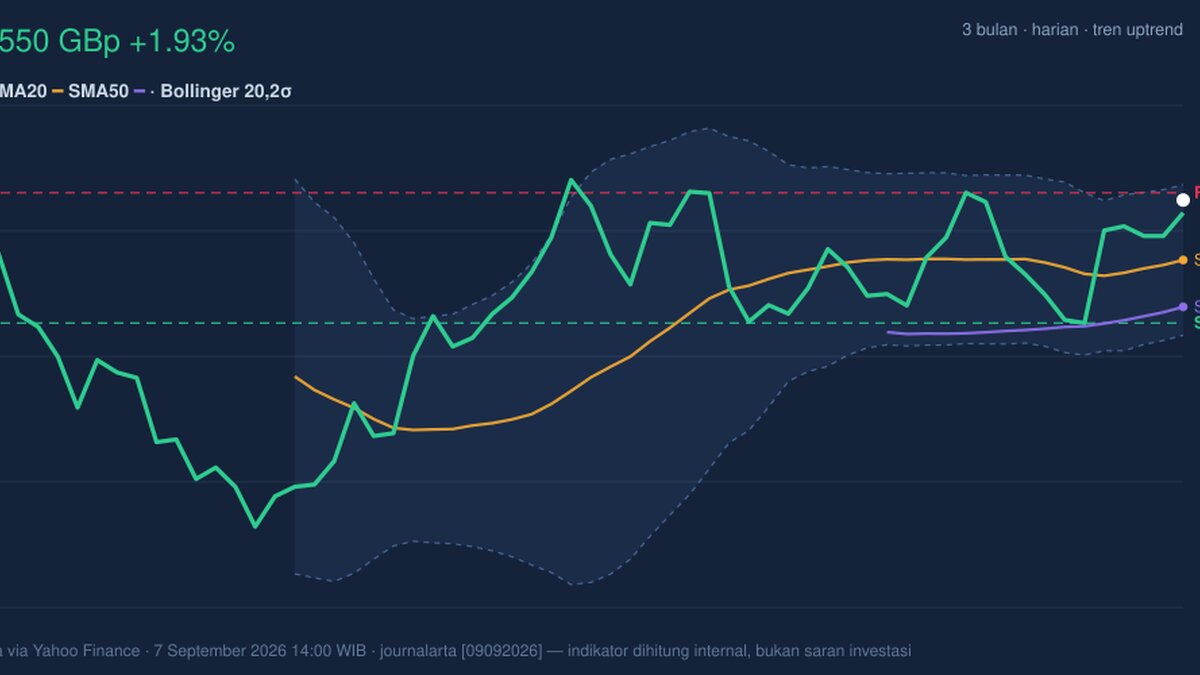
BP plc is pressing against the upper end of its recent range, with the shares at 550.10 GBp after a 1.93% daily rise, but the bigger message for international investors is that the move is being made inside a still-intact uptrend rather than a breakout already confirmed by broad participation.
The stock has gained 6.92% over five days and 6.36% over one month, which matters because it shows the advance is not a one-session spike. It is being carried by trend structure, yet the tape is also warning that momentum is getting close to a ceiling.
Trend & Price Action
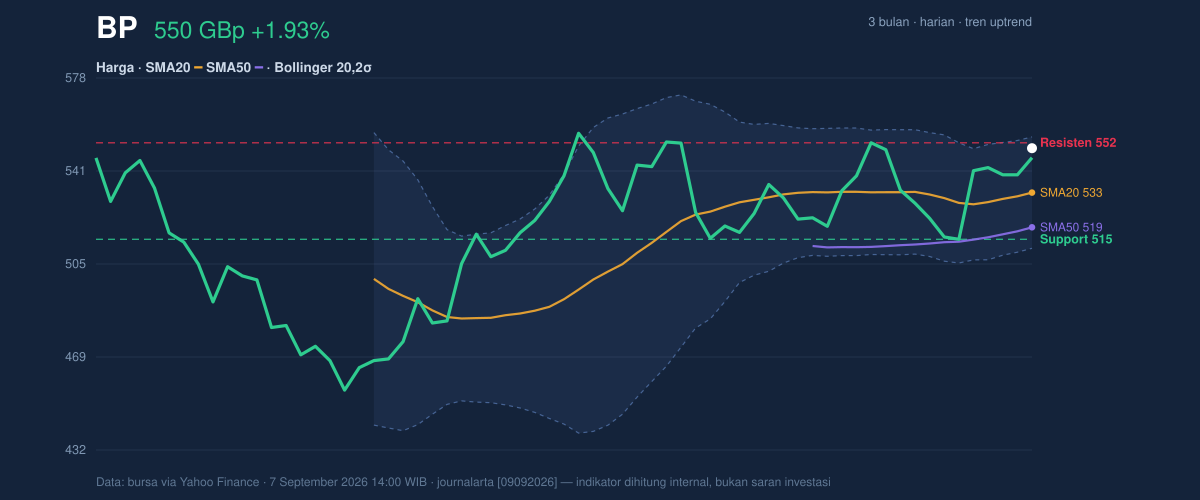
BP is trading above both its SMA20 at 532.76 and SMA50 at 519.19, a classic sign that short-term price action remains healthier than the medium-term average. The chart also shows the SMA20 rising at 0.76% over five days, which means the trend is not merely sideways drift: the average itself is climbing, and that usually reflects persistent buying pressure.
There is no fresh MA-cross, so this is not a new moving-average signal event. Instead, the market is extending an existing structure. That distinction matters. A fresh cross often attracts attention because it can mark a regime change; the absence of one here suggests investors are still working within a trend already in place.
As shown in the chart, the shares are trading near the top of the recent band, with 550.10 GBp sitting just below the 20-hour resistance at 552.20. The stock is also at 94% of its 20-hour range, which tells readers the market is spending most of its time near the upper boundary rather than the middle. That positioning usually implies strength, but it also leaves less room before sellers are likely to test the move.
Oscillators & Momentum
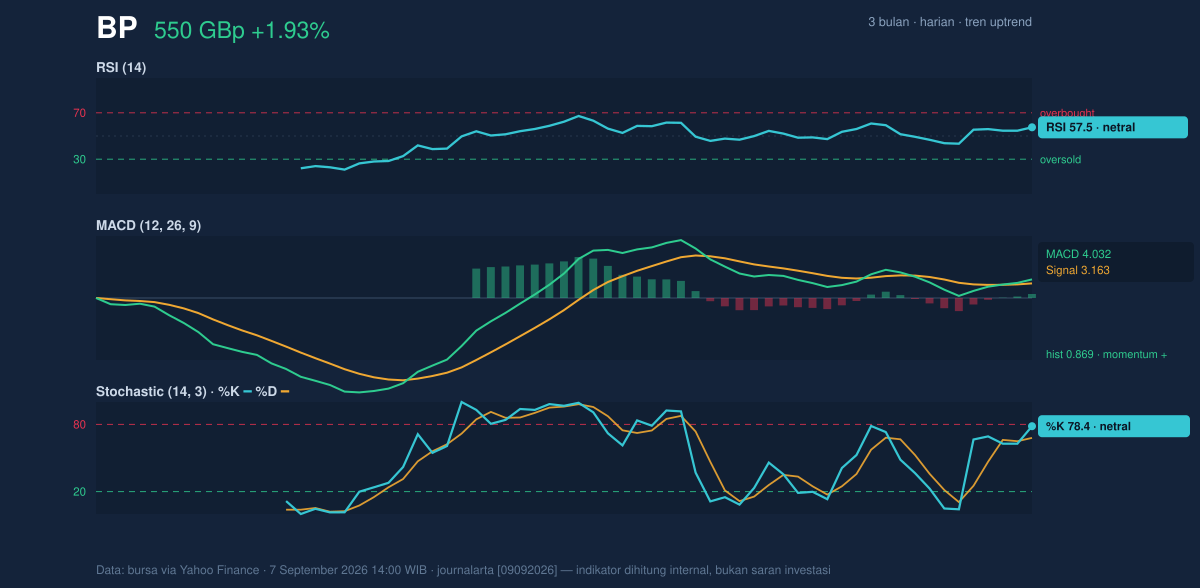
The momentum picture is constructive, but not euphoric. The RSI at 57.5 is neutral, meaning the market is not overbought even after the recent climb. That is important because it suggests the rally still has room before momentum becomes stretched. The Stochastic %K at 78.4 and %D at 68.0 are also neutral, but they sit near the upper end of their scale, which often means price is strong enough to stay elevated while also becoming more sensitive to pullbacks.
The clearest bullish signal comes from MACD at 4.032 versus its signal line at 3.163, with a positive histogram of 0.869. In plain English, MACD is saying upward momentum is still ahead of downward momentum. When the histogram is positive, the trend is usually still being confirmed rather than fading. That said, the fact that RSI and Stochastic are only neutral while MACD is positive suggests momentum is supportive, but not explosive.
As shown in the chart, the oscillators are aligned enough to back the trend, but they are not flashing the kind of deep oversold or extreme overbought reading that often precedes a sharp reversal.
Volatility & Volume
Bollinger Bands place the upper band at 554.50, the middle band at 532.76, and the lower band at 511.01. With %B at 90%, price is trading very close to the upper band. That usually means the stock is pressing the top of its recent volatility envelope. It can be a sign of strength, but also a sign that near-term upside may need fresh volume to continue.
The band width is 8.2%, described here as normal, so this is not a volatility squeeze waiting to explode. Instead, the market appears to be moving in a fairly standard range, with ATR at 14.44 or 2.6% of price, which points to moderate daily movement. That combination is useful: it means the stock can still travel, but not in a disorderly way.
Volume is the caution flag. The latest print of 36,037,928 is only 0.8x the 20-session average of 45,907,816, and OBV is falling. OBV, or on-balance volume, tracks whether volume is supporting price gains. A declining OBV while price rises often means the advance is being pushed by fewer hands than ideal. In other words, the chart is going up, but participation is not fully confirming it.
Key Levels & Scenarios
The nearest support is 514.50, while immediate resistance sits at 552.20. The 3-month range adds context: 562.90 is the recent high, and 450.60 is the low. That puts BP close to the upper end of its three-month band, reinforcing the idea that the market is extended but not yet broken.
If the shares clear 552.20 and hold above the 554.50 Bollinger upper band, the chart would suggest a stronger continuation attempt toward the prior 562.90 high. If, however, price fails to hold above 532.76 or slips back toward 514.50, the recent advance would begin to look more like a range-bound bounce than a durable trend extension.
Technical Verdict: HOLD (wait & see)
- MACD is positive, so momentum still supports the uptrend.
- Price is above SMA20 and SMA50, confirming the broader structure remains constructive.
- Volume is below average and OBV is falling, which weakens the quality of the move near resistance.
The verdict is invalidated if price falls below 514.50, because that would break the nearest support and weaken the current trend structure.
- Ideal Entry Range: 532.76 to 514.50
- Exit Target: 552.20, then 562.90 if resistance gives way
- Stop Loss Protection: below 511.01
For non-traders, this means BP is still trending higher, but the move is close enough to resistance that the market needs stronger participation before the next leg is convincing.
Summary Data BP
| Last price | 550.10 GBp |
| Change 1 day / 5 days / 1 month | 1.93% / 6.92% / 6.36% |
| Trend / MA-cross | uptrend / none |
| SMA20 / SMA50 | 532.76 / 519.19 |
| RSI (14) / Stochastic %K | 57.5 / 78.4 |
| Bollinger %B / ATR | 90% / 14.44 |
| Support / Resistance 20 days | 514.50 / 552.20 |
| Data as of | 7 September 2026 14:00 WIB |
Track BP share price daily: live levels, support/resistance and our full BP analysis history.



