CVX Stock Gains 0.58% Today, Testing Key Resistance
On September 9, 2026: price 209.80 USD, trend uptrend, RSI 65.2, support 196.60, resistance 211.78. technical analysis of cvx stock. CVX Stock Gains — full…
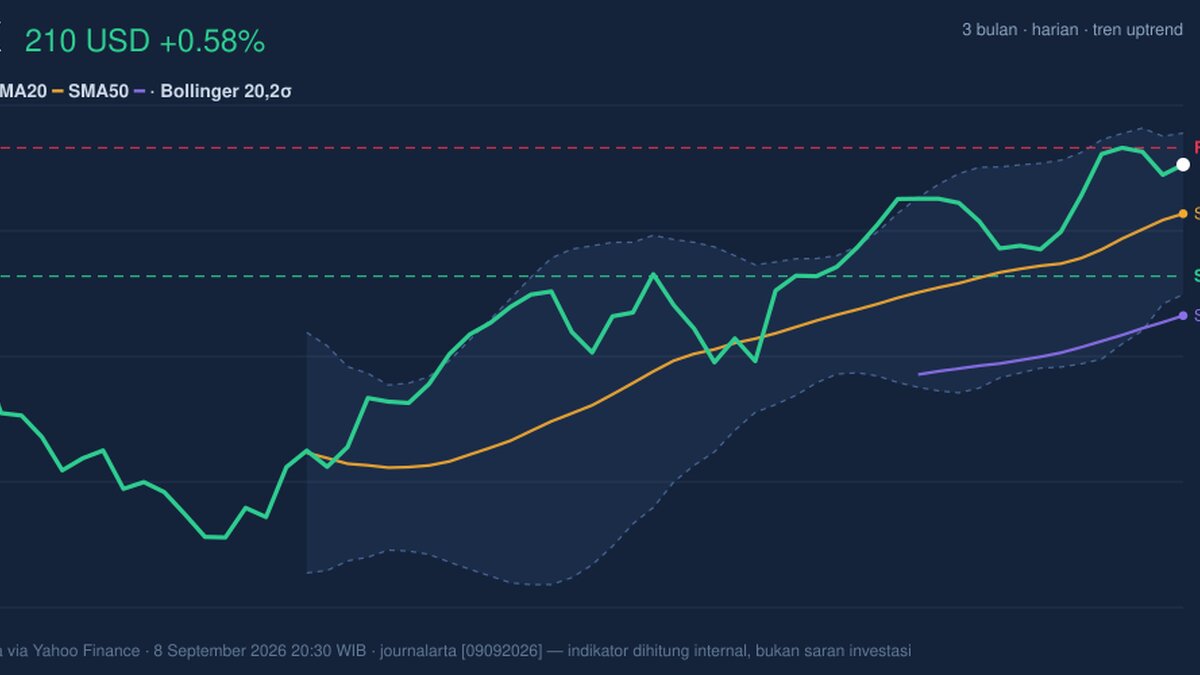
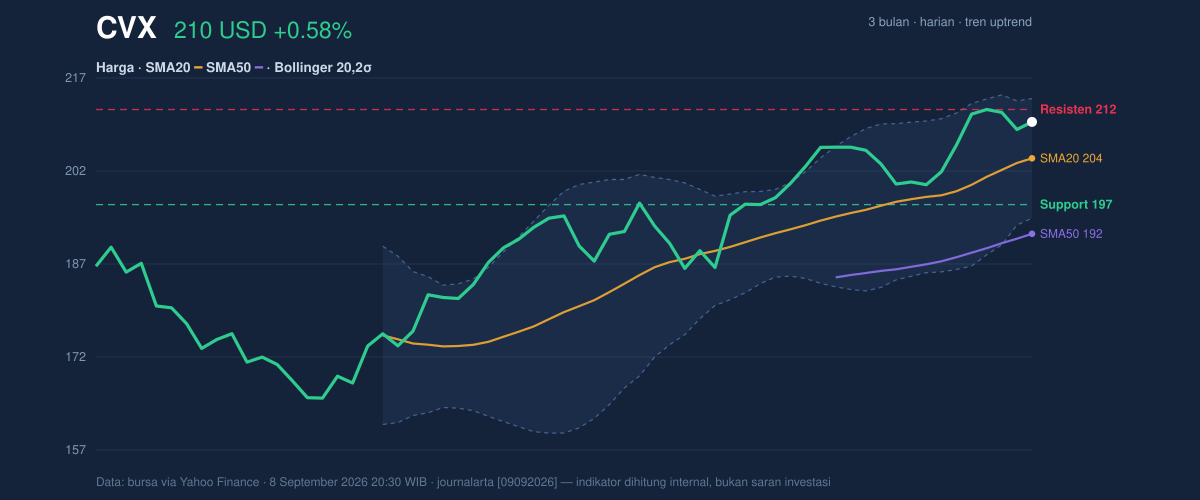
Chevron’s shares on the NYSE rose to 209.80 USD as of 8 September 2026 at 20:30 WIB, up 0.58% on the day and 7.64% over the past month, according to Yahoo Finance data. The move leaves CVX above its SMA20 at 203.99 and well above its SMA50 at 191.93, a setup that says the stock is not merely bouncing but remains in a broader upward structure. With price sitting near the top of its recent band and momentum still positive, the chart is signaling strength — but also that the easy part of the rally may already be behind it.
Trend & Price Action
The key message from the price structure is that Chevron is still trading in an established uptrend. The stock is above both its short-term and medium-term moving averages, and the SMA20 slope of 2.64% over 5 days shows the near-term trend is still rising rather than flattening out. That matters because a rising SMA20 often acts like a moving floor: when price stays above it, dips tend to be bought faster than they are in a weak tape.
The share price is also positioned near the upper end of its recent range, with 209.80 USD sitting at about 87% of the 20-hour range between 196.60 support and 211.78 resistance. That placement suggests buyers have already pushed the stock close to a known ceiling. The 3-month high of 213.31 is only slightly above current levels, so the market is testing a zone where supply has previously appeared.
What this means in plain language: Chevron is strong, but it is now close to where strength has to prove itself again.
Oscillators & Momentum
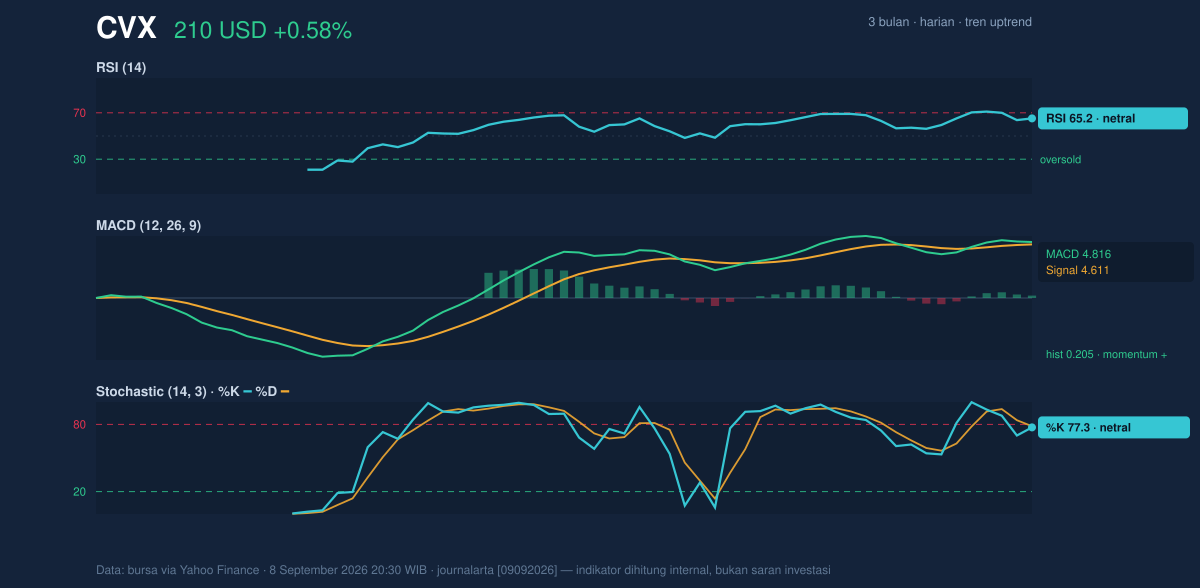
The momentum picture is constructive, though not explosive. RSI at 65.2 is still described as neutral in this dataset, but it sits high enough to show the stock has been in sustained demand. RSI measures the speed of recent gains versus losses; readings that climb toward the upper end of the range usually mean buyers are in control, while also warning that upside can become more stretched if the reading pushes much higher.
The stochastic oscillator, at %K 77.3 and %D 78.4, is also marked neutral, but the pair is hovering near the upper band of its range. Stochastic is useful for spotting whether price is closing near the top or bottom of its recent trading window. Here, it says Chevron is still trading near the high end of that window, which supports the uptrend but also signals that the stock is no longer cheap in short-term momentum terms.
The cleaner confirmation comes from MACD. With MACD at 4.816 above its signal line at 4.611 and a positive histogram of 0.205, momentum remains on the bullish side. MACD is a trend-following tool, and when the main line stays above the signal line, it usually implies the trend still has internal support. The histogram being positive means that bullish momentum is still expanding, even if only modestly.
In other words, the chart is not flashing reversal — it is saying the uptrend still has fuel, just not unlimited fuel.
Volatility & Volume
Volatility is present, but not excessive. Chevron’s ATR(14) of 3.74, equal to 1.8% of price, points to a market that can move meaningfully without being disorderly. ATR, or average true range, is a measure of typical daily movement; in this case it suggests traders should expect normal-sized swings rather than a sharp volatility break.
Bollinger Bands add an important nuance. Price is trading near the upper band at 213.52, with the middle band at 203.99 and the lower band at 194.45. The %B reading of 80% means the stock is leaning toward the top of the band structure, which usually reflects strength. At the same time, the 9.3% band width is described as normal, so this is not a squeeze setup — not the kind of compressed chart that often precedes a sharp breakout. Instead, it looks like an orderly trend with room to continue, but without a volatility trigger forcing a decisive move.
Volume is broadly supportive. Last volume came in at 7,703,900, just above the 7,494,810 average, or about 1.0× normal. That matters because price moves are more convincing when they are backed by participation. The rising OBV, or on-balance volume, reinforces the idea that money flow has been net positive: more volume has been associated with up days than down days.
This is not a thin rally.
Key Levels & Scenarios
The immediate battleground is clear. Resistance at 211.78 is the first level the market must overcome, while the 3-month high at 213.31 is the next reference point above that. On the downside, support at 196.60 is the first important level that has to hold to keep the bullish structure intact. Below that, the SMA20 at 203.99 becomes the key trend marker; if price slips under it, the recent advance starts to lose some of its short-term momentum character.
If Chevron clears 211.78 and holds above that area, the chart would be signaling that buyers are willing to pay up near the recent high. If it fails there, the stock may simply rotate back toward the middle of its Bollinger Band at 203.99, which would be a normal pause rather than a trend break.
Technical Verdict: HOLD (wait & see)
HOLD (wait & see) because the trend is still positive, but price is already pressing against near-term resistance and the upper Bollinger area.
- MACD remains positive, with the main line above signal and a bullish histogram, which supports trend continuation.
- Price is above SMA20 and SMA50, confirming the broader uptrend is intact.
- %B at 80% and price near 211.78 resistance suggest the stock is extended enough that fresh upside needs confirmation, not assumption.
Verdict invalidated if price falls below 196.60, which would mean the nearest support has failed and the short-term structure has weakened.
- Ideal entry range: 203.99 to 206.00
- Exit target: 211.78 to 213.31
- Stop loss protection: below 196.60
Plain English: Chevron still looks strong, but the chart is asking for proof before the next leg higher.
The next test is whether shares can hold above 211.78 after the latest close at 209.80.
Summary Data CVX
| Last price | 209.80 USD |
| Change 1 day / 5 days / 1 month | 0.58% / 1.78% / 7.64% |
| Trend / MA-cross | uptrend / none |
| SMA20 / SMA50 | 203.99 / 191.93 |
| RSI (14) / Stochastic %K | 65.2 / 77.3 |
| Bollinger %B / ATR | 80% / 3.74 |
| Support / Resistance 20 days | 196.60 / 211.78 |
| Data as of | 8 September 2026 20:30 WIB |
Track CVX stock price daily: live levels, support/resistance and our full CVX analysis history.



