DBS Stock Drops 0.47% Today, Testing Key Resistance
On September 9, 2026: price 78.10 SGD, trend uptrend, RSI 63.7, support 75.53, resistance 78.65. technical analysis of dbs stock. DBS Stock Drops — full…
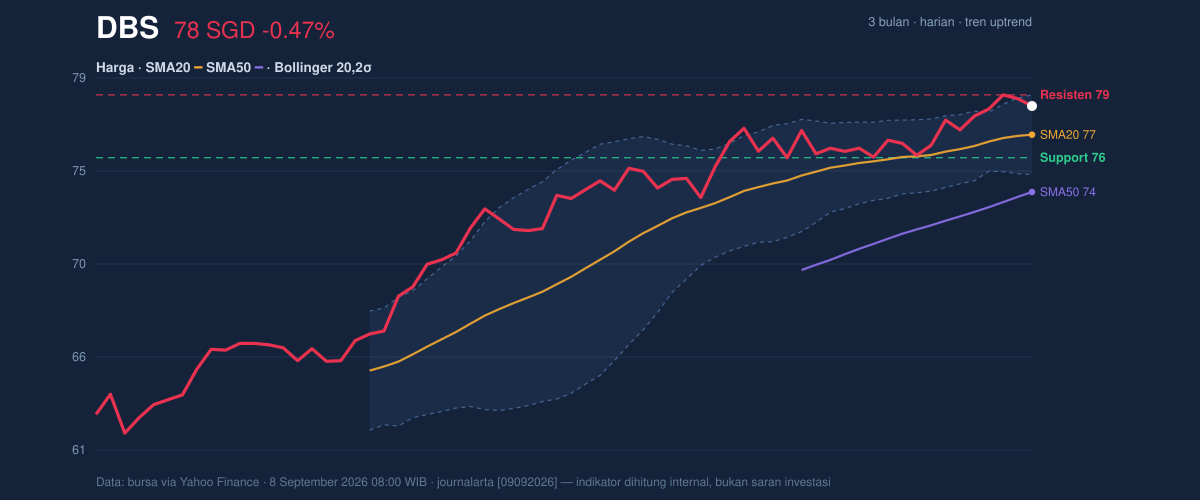
DBS Group Holdings traded at SGD 78.10, easing 0.47% from the previous close as the counter hovered just below the upper edge of its near-term range, according to data from Yahoo Finance via SGX-linked market feeds on 8 September 2026, 08:00 WIB. The move matters less for the size of the pullback than for where it happened: the shares are still sitting above the SMA20 at SGD 76.67 and well above the SMA50 at SGD 73.82, which keeps the broader trend constructive even after a one-day pause. The chart shows a stock that is not breaking down — it is testing the ceiling.
Trend & Price Action
The price structure remains aligned with an uptrend, helped by the 0.94%/5-day slope in the SMA20. In plain language, the short-term average is still rising, which usually means recent trading has been strong enough to pull the trend line upward rather than flatten it. DBS is also trading above both the SMA20 and SMA50, a classic sign that buyers have been in control over both the short and medium term. There is no fresh MA-cross, so the market is not getting a new trend signal from the moving averages; instead, it is extending an already-established one.
The stock is also positioned near the top of its recent band. With support at SGD 75.53 and resistance at SGD 78.65, DBS is sitting at 82% of the range. That tells you the shares are closer to the upper boundary than the lower one, which often means upside is being tested rather than freshly discovered.
The practical message is simple: the trend is intact, but the easy part of the move may already have happened.
Oscillators & Momentum
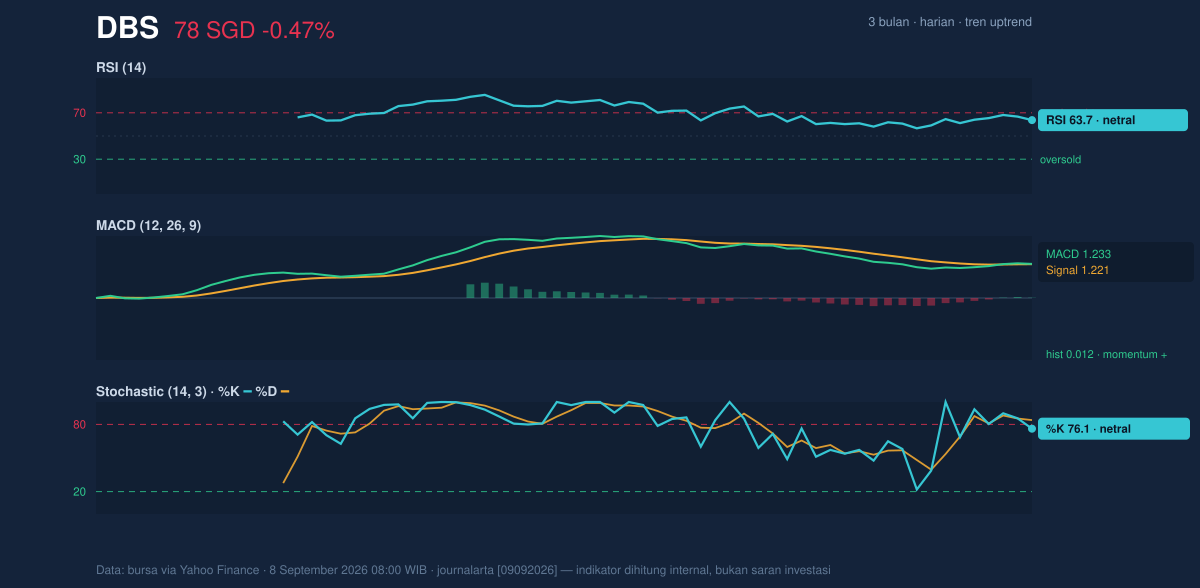
Momentum indicators are mixed in tone, but not bearish. RSI at 63.7 is described as neutral, which is important because it says the stock is not yet in a stretched condition that would normally scream exhaustion. RSI is often read as a gauge of how far a move has run; here, it suggests DBS has room to continue without immediately entering a classic overbought zone.
The Stochastic %K at 76.1 and %D at 83.8 is also marked neutral, but the setup is a little more delicate. Stochastic tends to react faster than RSI, so when it sits high in the range, it can hint that short-term momentum is strong but vulnerable to cooling if price stalls near resistance. In this case, the reading is not a reversal warning on its own — it is more a sign that the stock is pressing the upper end of its recent climb.
The cleaner signal comes from MACD. MACD at 1.233 sits just above the signal line at 1.221, leaving a thin but positive histogram of 0.012. That means upside momentum is still present, though only modestly. The gap is narrow, so the trend is not accelerating aggressively; it is advancing, but with caution.
This is the kind of momentum profile that often accompanies a mature uptrend: positive, but not euphoric.
Volatility & Volume
Volatility is unusually restrained. The ATR(14) at 0.93, equal to 1.2% of price, points to low volatility. ATR measures the typical daily trading range, so a subdued reading implies DBS has not been swinging wildly. That can be constructive in an uptrend because it often signals orderly participation rather than panic-driven trading.
The Bollinger Bands add an important layer. With the upper band at SGD 78.65, the middle band at SGD 76.67, and the lower band at SGD 74.69, DBS is trading near the top of the envelope at a %B of 86%. That means price is close to the upper band, a sign of strength, but also close enough to resistance that follow-through will matter. More interestingly, the 5.2% band width is tightening, suggesting a squeeze. In market terms, squeezes do not predict direction by themselves; they warn that the stock may be storing energy for a larger move once it leaves the narrow channel.
Volume, however, has not yet confirmed urgency. Last trade volume of 2,702,600 compares with a 20-hour average of 3,686,340, or about 0.7× normal. That means the latest push is happening on lighter participation. The OBV is rising, which offsets that a little by showing that cumulative volume flow still favors accumulation. Put together, the tape says investors remain engaged, but the latest advance has not been powered by a surge of fresh turnover.
The chart is tightening, but the crowd is not rushing in yet.
Key Levels & Scenarios
The immediate battleground is clear. SGD 78.65 is both the upper Bollinger band and the 20-hour resistance. A decisive move through that level would signal that DBS is not just hovering near the top of its range, but actually escaping it. Below, SGD 75.53 is the nearest support; that is the line that would matter if the recent consolidation loses shape. The broader structure is framed by the 3-month high at SGD 79.05 and the 3-month low at SGD 61.60, which shows how far the stock has already recovered from its lower base.
If price holds above the SMA20 at SGD 76.67 and reclaims the SGD 78.65 ceiling, the chart would suggest continuation of the existing trend. If it slips back below the SGD 75.53 support, the recent squeeze would begin to look less like a launchpad and more like a pause that failed.
Technical Verdict: HOLD (wait & see)
The setup is constructive, but not decisive enough to call it a clean trend acceleration.
- MACD is positive, but the histogram at 0.012 shows only a thin margin over the signal line.
- Price remains above the SMA20 and SMA50, confirming the uptrend, yet it is already near SGD 78.65 resistance.
- Bollinger Bands are squeezing, which often precedes a breakout, but volume is only 0.7× normal, so confirmation is still missing.
- Invalidation condition: this verdict is invalidated if price falls below SGD 75.53.
- Ideal Entry Range: SGD 76.67 to SGD 75.53
- Exit Target: SGD 78.65 to SGD 79.05
- Stop Loss protection: below SGD 75.53
For non-traders: DBS is still trending higher, but it is now close to resistance, so the chart is asking for proof before it makes its next move.
“The stock is tight, the range is narrow, and the next break will matter more than the last tick.”
Summary Data DBS
| Last price | 78.10 SGD |
| Change 1 day / 5 days / 1 month | -0.47% / 1.55% / 1.44% |
| Trend / MA-cross | uptrend / none |
| SMA20 / SMA50 | 76.67 / 73.82 |
| RSI (14) / Stochastic %K | 63.7 / 76.1 |
| Bollinger %B / ATR | 86% / 0.93 |
| Support / Resistance 20 days | 75.53 / 78.65 |
| Data as of | 8 September 2026 08:00 WIB |
Track DBS share price daily: live levels, support/resistance and our full DBS analysis history.



