Death Cross Pressure, Tencent Stock Drops 0.68% Today
On September 9, 2026: price 435.40 HKD, trend downtrend, RSI 42.2, support 433.00, resistance 461.60. technical analysis of tencent stock.
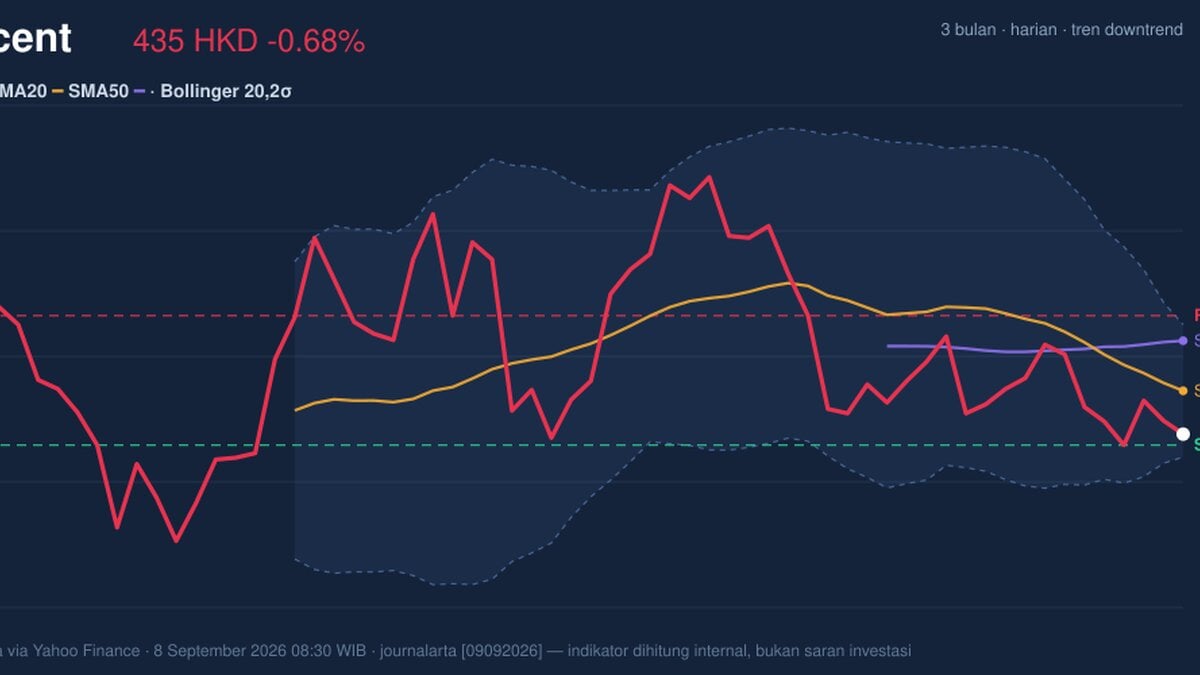
Tencent Holdings fell on the Hong Kong exchange on 8 September 2026, with 0700.HK last changing hands at 435.40 HKD, down 0.68% from the previous close of 438.40, as the stock stayed pinned below its short- and medium-term averages and near the lower edge of its Bollinger band. The move matters because it is not just a one-day slip: the shares have lost 7.52% over one month, the trend is now marked as a downtrend, and the chart is showing a market that is still trying to find a floor rather than one that has already turned. In plain terms, sellers remain in control, even if some momentum gauges are beginning to look stretched.
Trend & Price Action
The price structure is still weak. Tencent is trading below the SMA20 at 444.98 and further under the SMA50 at 456.04, which is the classic setup for a bearish intermediate trend. The death cross — where the 20-day average has crossed below the 50-day average — reinforces that message: short-term weakness has become broad enough to pull the longer trend down with it. The SMA20 slope is also negative at -2.35% over 5 days, showing the moving average itself is falling, not merely being tested.
The stock is not collapsing, but it is trading in a vulnerable zone. As shown in the chart, the last price sits just above the lower Bollinger band at 430.36, with %B at 17%, meaning price is positioned near the bottom of its recent trading envelope. That usually signals pressure, but it can also hint that the market is getting close to an exhaustion point if sellers fail to push it much lower.
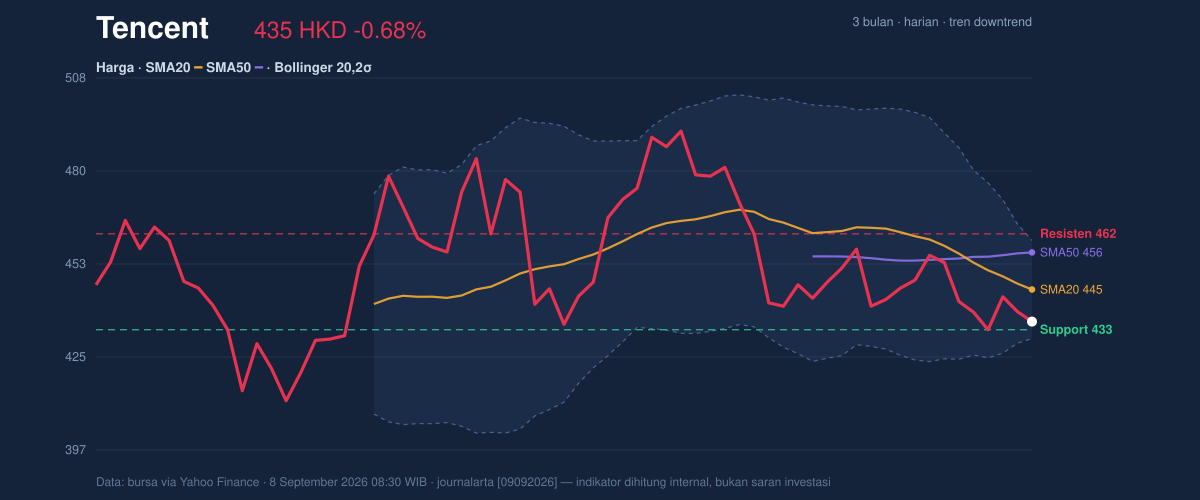
The 20-day support at 433.00 is now the immediate line to watch, while 461.60 is the first meaningful resistance. Tencent is currently only about 8% into its 20-day range, which tells readers the stock is drifting near the lower end rather than building upward traction. The 3-month range adds context: the shares are still well below the 497.80 high, but above the 411.00 low, so the broader damage is real without being terminal.
Short and sharp: the chart still leans down.
Oscillators & Momentum
Momentum is mixed, and that is what makes the setup interesting. The RSI at 42.2 is neutral, not oversold, which means the stock has not yet reached the kind of washed-out reading that often accompanies a cleaner reversal. But the Stochastic %K at 8.2 versus %D at 20.1 is clearly oversold, showing the latest selling has pushed Tencent into a near-term pressure zone. In practical terms, stochastic is saying the stock is near the lower end of its recent range, even if RSI has not fully caught up.
The MACD picture is less forgiving. With MACD at -5.599, the signal line at -4.518, and a histogram of -1.081, momentum remains negative and still below the trigger line. That means the bearish trend has not just persisted — it is still being confirmed by trend-following momentum. The gap between MACD and signal is also important: it suggests downside momentum is not yet fully exhausted.
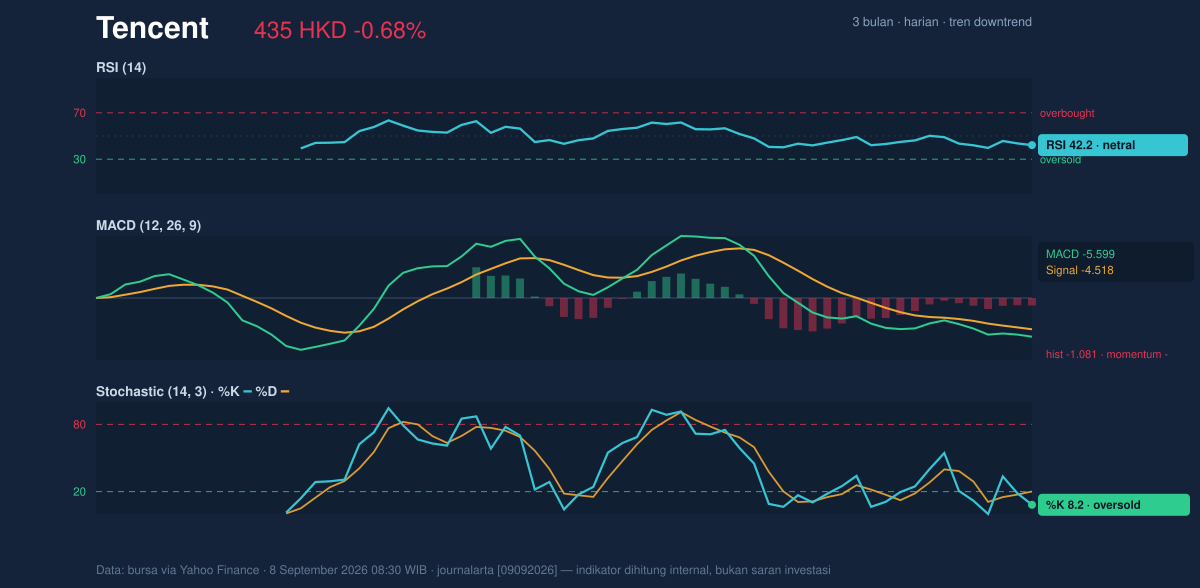
So the oscillators are split: short-term oversold, broader momentum still negative.
Volatility & Volume
Volatility is present, but not extreme. The ATR(14) at 10.46, or 2.4% of price, points to a market that can move, but not in disorderly fashion. More important is the Bollinger band width of 6.6%, which is described as a squeeze. A squeeze often means the stock is coiling for a larger move after a period of compression. That does not tell direction on its own, but in a stock already sitting below its moving averages, the market has to prove any upside attempt with follow-through rather than just a brief bounce.
Volume does not yet offer that proof. Last volume was 10,414,838, about 0.5x the 20-day average of 22,476,889, which means participation was light. When a stock falls on weak volume, it can mean the selling is not panicked; equally, it can mean buyers are not stepping in with conviction. The OBV is down, and that matters because on-balance volume tracks whether money flow is broadly accumulating or leaving the stock. Here, it says distribution is still the dominant pattern.
Weak volume, falling OBV, no clear accumulation.
Key Levels & Scenarios
The nearest support is 433.00, almost directly under the current price, with the Bollinger lower band at 430.36 acting as a second technical floor. If Tencent loses that zone decisively, the chart would expose the lower end of the 3-month range near 411.00. On the upside, the first barrier is 444.98 at the SMA20, followed by 456.04 at the SMA50 and then 461.60 resistance.
If the stock can reclaim 444.98 and hold above it, that would be the first sign the short-term downtrend is easing. If it fails to hold 433.00, the market would likely be telling traders the squeeze is resolving lower rather than higher.
Technical Verdict: HOLD (wait & see)
HOLD (wait & see) fits best because the stock is still in a downtrend, remains below the SMA20 and SMA50, and the MACD is still negative; however, Stochastic is oversold and price is pressing near lower Bollinger support, which leaves room for a technical bounce if selling pressure eases.
- Ideal Entry Range: 430.36 to 444.98, using the lower Bollinger band and SMA20 zone as the main technical area.
- Exit Target: 456.04 to 461.60, where the SMA50 and 20-day resistance sit.
- Stop Loss protection: below 430.36, with added caution if 433.00 fails to hold.
- Verdict invalidated if price breaks below 430.36, because that would signal the lower band has given way and downside pressure is still expanding.
For non-traders: the stock is weak, but it is close enough to support that the next move could be a bounce or a deeper slip, and the chart has not yet chosen. “The market is telling us it hasn’t finished deciding.”
Summary Data Tencent
| Last price | 435.40 HKD |
| Change 1 day / 5 days / 1 month | -0.68% / -1.36% / -7.52% |
| Trend / MA-cross | downtrend / death |
| SMA20 / SMA50 | 444.98 / 456.04 |
| RSI (14) / Stochastic %K | 42.2 / 8.2 |
| Bollinger %B / ATR | 17% / 10.46 |
| Support / Resistance 20 days | 433.00 / 461.60 |
| Data as of | 8 September 2026 08:30 WIB |
Track Tencent share price daily: live levels, support/resistance and our full Tencent analysis history.



