OCBC Stock Drops 0.56% Today, Momentum Weakens
On September 9, 2026: price 31.70 SGD, trend uptrend, RSI 61.4, support 30.78, resistance 32.27. technical analysis of ocbc stock. OCBC Stock Drops — full…
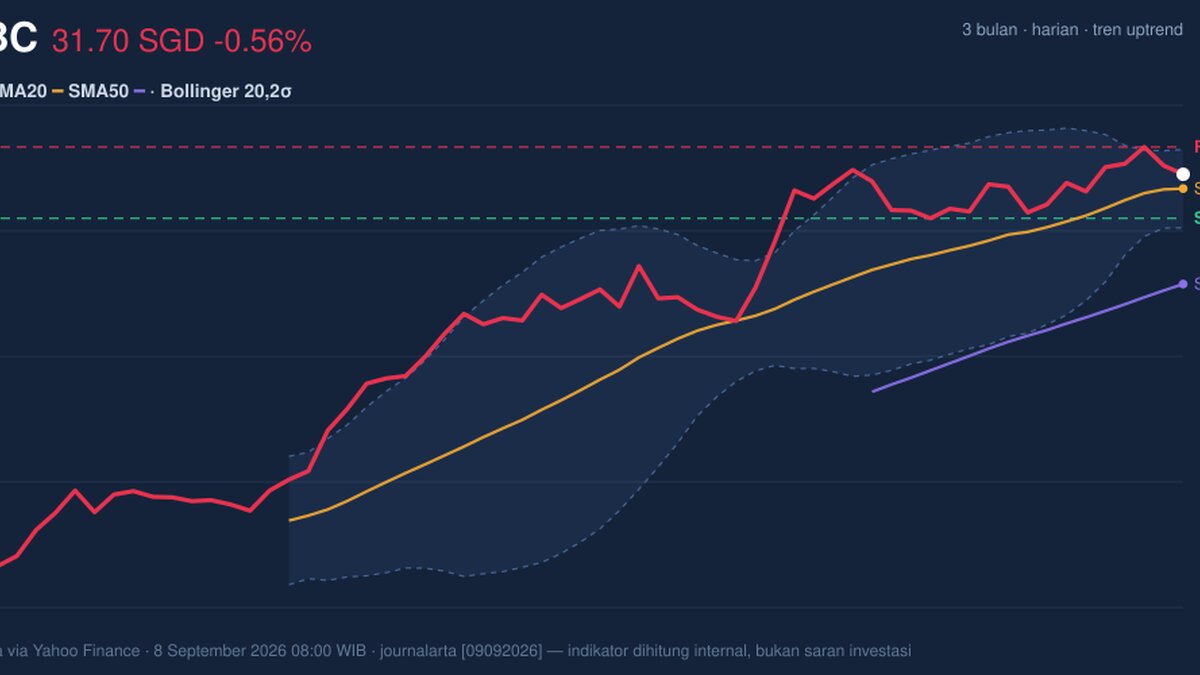
OCBC Bank’s shares on SGX ended at SGD 31.70, down 0.56% from the previous close of 31.88, according to data from Yahoo Finance via the exchange. The move leaves the stock still above its short- and medium-term trend markers, but the latest tape is more cautious than the price action alone suggests. The reason is simple: OCBC is holding an uptrend, yet the momentum underneath has started to soften, which often matters more than the headline direction.
Trend & Price Action
The stock remains in an uptrend, with the SMA20 at 31.40 rising at a slope of 1.83% over 5 days. That matters because a rising 20-day average usually signals that recent buyers are still willing to pay higher prices, even after a small pullback. OCBC is also trading well above its SMA50 at 29.40, which shows the broader medium-term structure is intact and that the share price is not merely drifting, but still operating above a more established base.
There has been no new MA-cross, so the chart is not flashing a fresh trend-change signal. In plain language, the moving averages are not delivering a new bullish or bearish crossover; instead, they are reinforcing an existing trend that is already in place. As shown in the chart, price is sitting in the upper half of its recent band and is positioned at about 62% of the 20-session range, which suggests buyers have kept control, though not decisively enough to force a breakout yet.
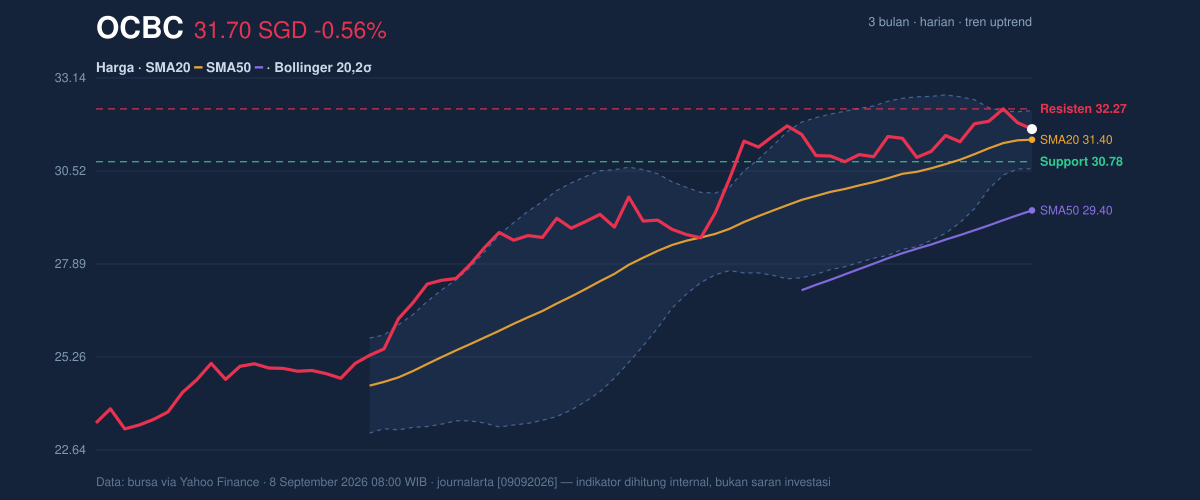
The broader context is also constructive. OCBC is trading below its 3-month high of 32.57 but comfortably above the 3-month low of 23.11. That places the stock nearer the top of its recent range, which is usually a sign of resilience, but also means the next move matters: stocks near the upper end of a range often need stronger volume to extend higher.
Oscillators & Momentum
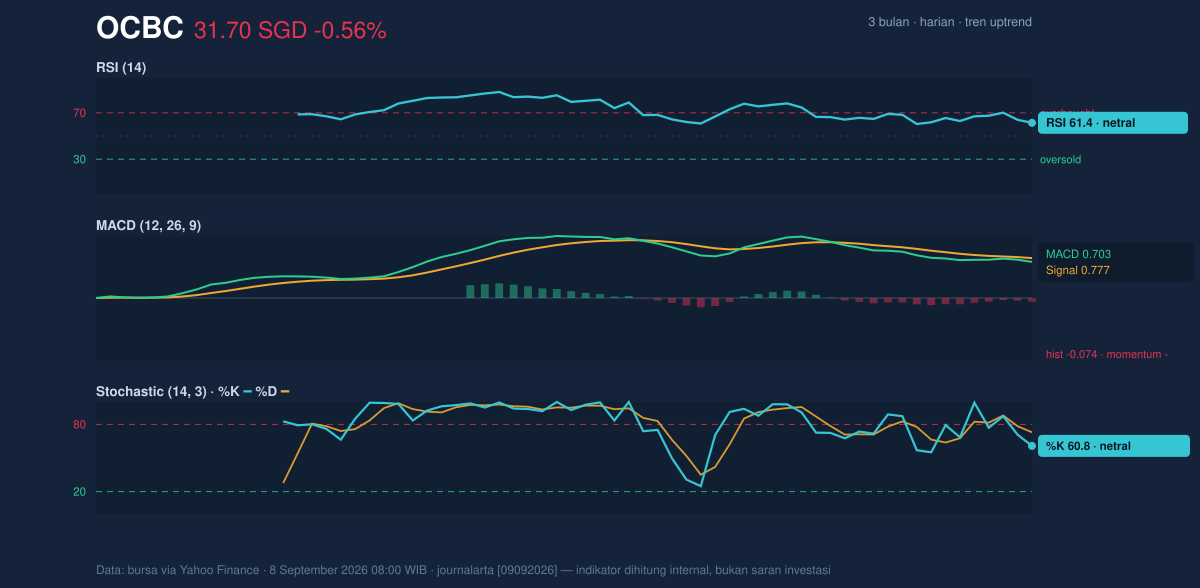
The oscillator picture is mixed rather than emphatic. RSI at 61.4 is best described as neutral; it is not stretched into overbought territory, but it is also not weak enough to suggest a deep discount. That usually means the stock still has room to move either way, depending on whether buyers or sellers take control near the next technical barrier.
The Stochastic %K at 60.8 and %D at 73.0 also sit in neutral territory, but the gap between the two lines hints that short-term momentum has cooled from stronger levels. Stochastic is often useful for spotting whether price is running ahead of itself; here, it is more a sign of fading enthusiasm than outright reversal pressure.
The clearest caution comes from MACD. MACD at 0.703 remains positive, which means the trend has not broken, but it is below the signal line at 0.777 and the histogram is -0.074. That negative histogram is important because it shows momentum has slipped under the trend signal. In practical terms, the stock is still in an uptrend, but the engine is not accelerating; it is idling a little more than before.
Volatility & Volume
Volatility is not extreme, but it is not sleepy either. The ATR(14) of 0.51, equal to 1.6% of price, points to moderate volatility, meaning normal daily swings are still large enough to matter. This is where the Bollinger setup becomes more interesting. The bands are relatively tight, with a 5.2% width, and the chart shows a squeeze, which often precedes a stronger directional move. A squeeze does not tell you the direction; it tells you pressure is building.
At the same time, %B at 68% shows price is leaning toward the upper half of the Bollinger envelope, which is consistent with an underlying bid in the shares. The issue is participation. Latest volume was 4,781,500, below the 20-day average of 5,813,124, or about 0.8× normal. That means the latest move lower did not come with heavy selling. Meanwhile, OBV is rising, which suggests the broader volume trend still supports accumulation even if the most recent session was quieter than usual.
Key Levels & Scenarios
The immediate map is clear. Support at 30.78 is the first level to watch on the downside, while resistance at 32.27 is the nearest ceiling on the upside. The stock closed between those markers and is not far from the upper side of the range, so the next test will likely tell traders whether the squeeze resolves upward or stalls.
If OCBC holds above 30.78, the chart keeps its constructive tone and the rising SMA20 remains a valid guide. If it pushes through 32.27, the move would signal that the squeeze is resolving with strength and that the market is willing to challenge the 3-month high of 32.57. If price fails to hold 30.78, the setup becomes less convincing, because that would place the stock back toward the lower edge of the recent band and weaken the case that buyers are in control.
Technical Verdict: HOLD (wait & see)
HOLD (wait & see) fits best because the trend is still positive, but momentum has softened and volume confirmation is not strong enough for a cleaner directional call.
- Reason 1: Trend remains intact — price is above the SMA20 at 31.40 and far above the SMA50 at 29.40.
- Reason 2: Momentum is mixed — RSI 61.4 and Stochastic 60.8/73.0 are neutral, while MACD is below its signal line with a -0.074 histogram.
- Reason 3: Bollinger squeeze — the 5.2% band width suggests a breakout may be building, but direction is not yet confirmed.
- Verdict invalidated if price breaks below 30.78, because that would weaken the short-term support structure.
- Ideal Entry Range: 30.78 to 31.40
- Exit Target (Target Price): 32.27 to 32.57
- Stop Loss protection: below 30.58
In plain English, OCBC still looks technically firm, but the chart is waiting for a clearer push before the next move shows its hand.
Summary Data OCBC
| Last price | 31.70 SGD |
| Change 1 day / 5 days / 1 month | -0.56% / 1.15% / 1.08% |
| Trend / MA-cross | uptrend / none |
| SMA20 / SMA50 | 31.40 / 29.40 |
| RSI (14) / Stochastic %K | 61.4 / 60.8 |
| Bollinger %B / ATR | 68% / 0.51 |
| Support / Resistance 20 days | 30.78 / 32.27 |
| Data as of | 8 September 2026 08:00 WIB |
Track OCBC share price daily: live levels, support/resistance and our full OCBC analysis history.



