ORCL Stock Gains 2.36%, Testing Key Resistance In Focus
On September 9, 2026: price 162.52 USD, trend uptrend, RSI 62.9, support 141.32, resistance 162.52. technical analysis of orcl stock. ORCL Stock Gains — full…
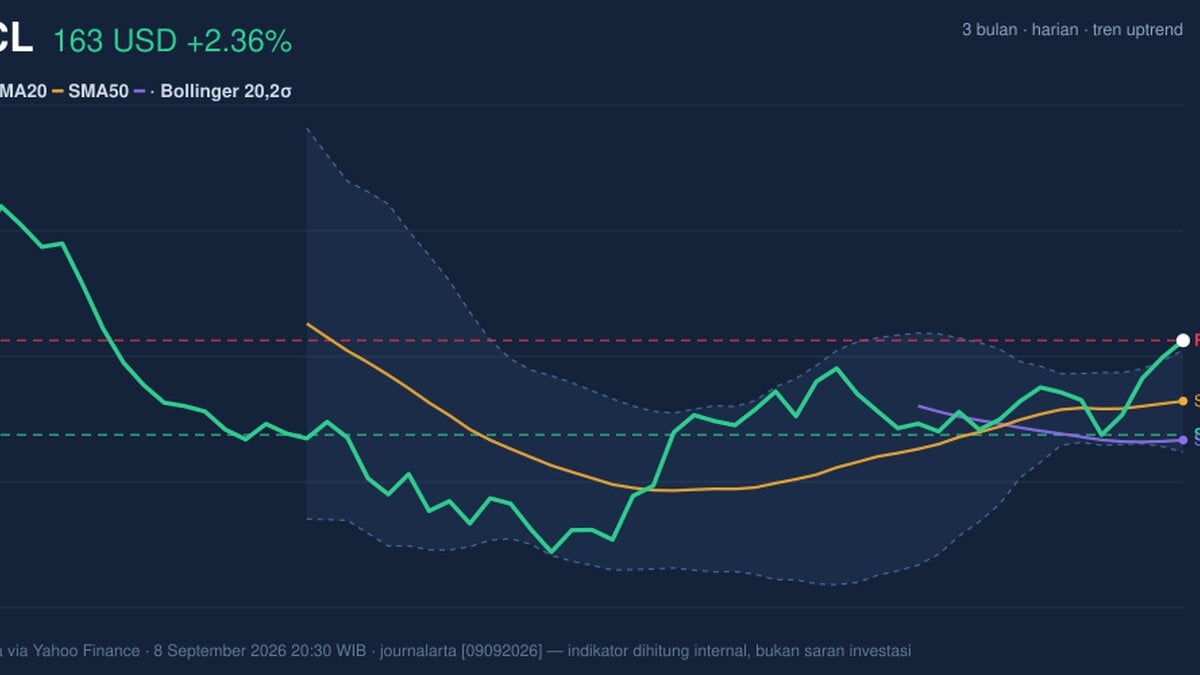
Oracle is pressing into a fresh high end of its recent range, and the move matters beyond Wall Street because it signals how investors are pricing enterprise software demand, cloud spending and the durability of big U.S. tech earnings.
Oracle shares on the NYSE closed at 162.52 USD, up 2.36% on the day and extending gains to 8.99% over 5 days and 7.59% over 1 month, according to market data via Yahoo Finance. The stock is now trading well above both its SMA20 at 148.88 and SMA50 at 140.12, a classic sign that the medium-term trend remains constructive. What matters here is not just that price is higher, but that it is doing so with the slope of the SMA20 rising 1.04% over 5 days, which means the trend is still being reinforced rather than merely bouncing from a low.
Trend & Price Action
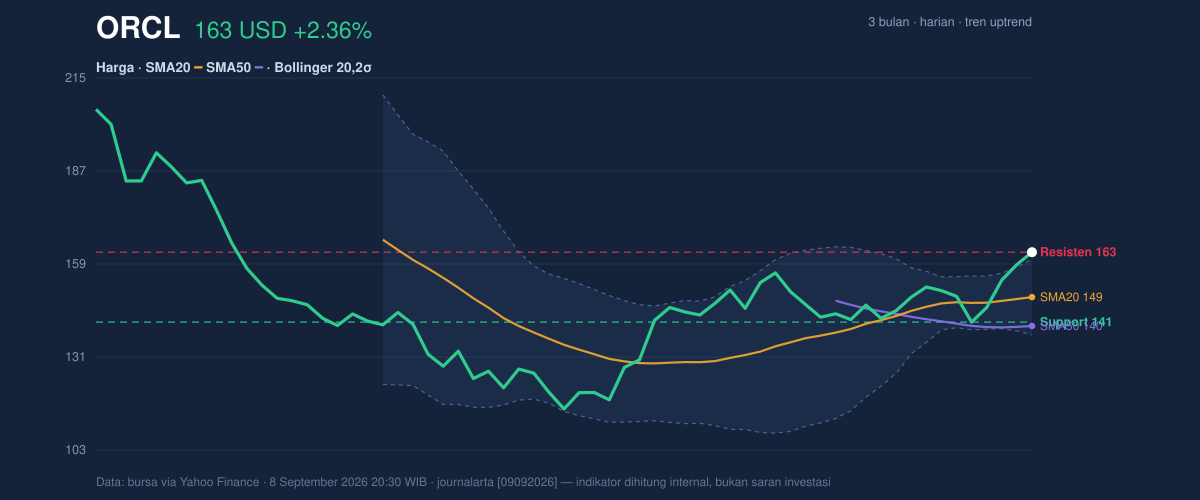
The chart shows a stock that has moved from recovery into momentum-led expansion. Oracle is sitting at the very top of its 20-hour support/resistance range, with support at 141.32 and resistance at 162.52. In practical terms, that means price has already reached the upper edge of the recent trading box, leaving less room for a straightforward continuation unless fresh demand keeps arriving. The broader context is still favorable: the shares are far above the 3-month low of 114.50 and below the 3-month high of 220.50, so the market is neither in distress nor in full breakout territory.
The important signal is that Oracle is trading above the SMA20 and SMA50 without a new moving-average cross. That usually means the trend is already established, and the question shifts from “is it improving?” to “can it sustain the advance?” The answer is being tested at the current high end of the range.
Oscillators & Momentum
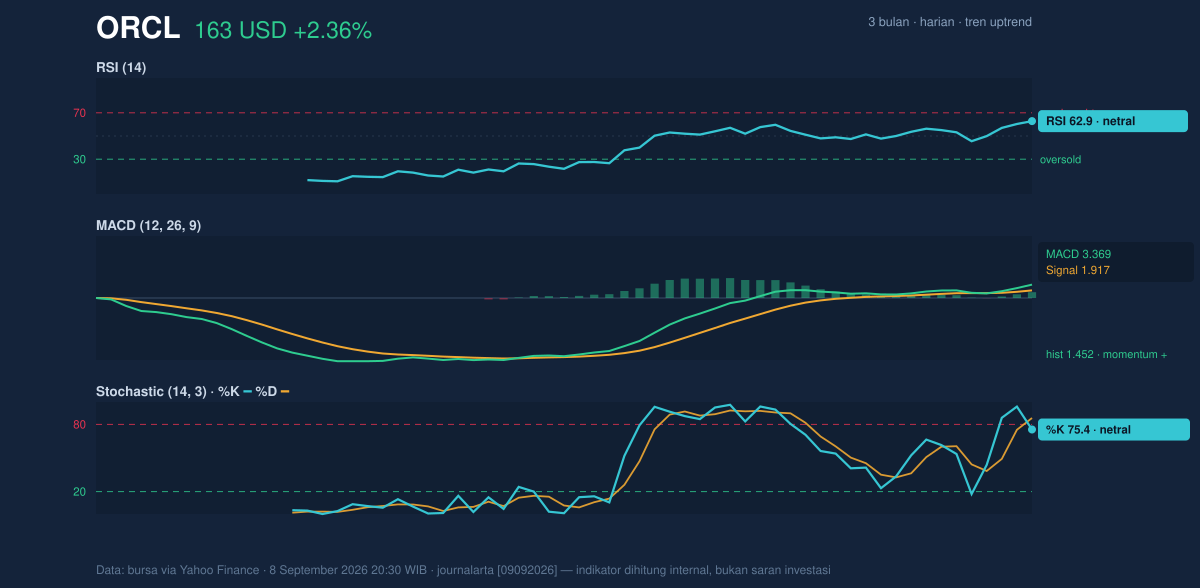
The momentum gauges are supportive, but not euphoric. RSI at 62.9 is still described as neutral, which means the stock has room to run before it enters the kind of overheated zone that often attracts profit-taking. Meanwhile, Stochastic %K at 75.4 and %D at 85.7 also sit in neutral territory, but they are elevated enough to show the stock is trading with near-term strength rather than drifting sideways. In plain language, the oscillator picture says the rally has energy, but it is getting close to the upper band of short-term enthusiasm.
The clearest confirmation comes from MACD at 3.369 versus a signal line at 1.917, with a positive histogram of 1.452. MACD measures whether upward momentum is accelerating or fading; here, it is still accelerating. That matters because it supports the price move rather than hinting at a false breakout.
Volatility & Volume
Oracle’s %B at 109% shows price has pushed above the upper Bollinger Band at 160.34. That is a strong momentum signal, but it also means the stock is trading in stretched territory relative to its recent average. The Bollinger Band width is 15.4%, described as normal, so this is not a squeeze about to explode; it is more of a steady expansion phase. The message is that the market is willing to pay above the recent statistical ceiling, but that usually comes with a higher risk of short-term pullback if buyers pause.
Volatility is not trivial here. ATR at 6.76, equal to 4.2% of price, indicates high daily movement potential. That means swings can be meaningful even when the trend is rising. Volume adds confirmation: the latest session printed 37,505,700 shares, about 1.6× the 20-session average of 23,385,620, while OBV is rising. Rising OBV means volume is backing the advance rather than contradicting it, which is one of the cleaner signs that the move has participation behind it.
This is not a quiet drift higher. It is a crowded move with real sponsorship.
Key Levels & Scenarios
The immediate technical question is whether Oracle can hold above the upper band and recent resistance it has just reached. If price sustains above 162.52, the market is effectively in price discovery above the latest range ceiling. If it fails to hold that level, the first area to watch is the Bollinger upper band at 160.34, followed by the SMA20 at 148.88. A deeper loss of trend control would point toward the 141.32 support zone, which is the most important near-term floor in the data.
Because the stock is already at the top of its 20-hour range, the setup is less about chasing and more about whether the breakout can be absorbed by the market without immediate reversal. The elevated ATR suggests either outcome could unfold quickly.
Technical Verdict: HOLD (wait & see)
HOLD (wait & see) — the trend is positive, but the stock is stretched at the upper edge of its recent range.
- MACD remains positive, with the histogram still above zero, which supports continuation.
- Price is above SMA20 and SMA50, confirming the broader uptrend is intact.
- %B at 109% and price at 162.52 show the shares are extended above the upper Bollinger Band, so near-term upside may need consolidation first.
Verdict invalidated if price falls below 141.32, the 20-hour support level.
- Ideal Entry Range: around 160.34 to 148.88, using the upper Bollinger band and SMA20 as the first technical area to monitor.
- Exit Target: 162.52 as the immediate resistance/trigger zone, with the next reference only being the recent 3-month high of 220.50.
- Stop Loss protection: below 141.32, where the recent support structure fails.
For non-traders, this means Oracle’s trend is healthy, but the shares are already running hot, so the next move matters more than the last one.
“The stock is strong, but the real test is whether buyers can keep paying up at the edge of the range.”
Summary Data ORCL
| Last price | 162.52 USD |
| Change 1 day / 5 days / 1 month | 2.36% / 8.99% / 7.59% |
| Trend / MA-cross | uptrend / none |
| SMA20 / SMA50 | 148.88 / 140.12 |
| RSI (14) / Stochastic %K | 62.9 / 75.4 |
| Bollinger %B / ATR | 109% / 6.76 |
| Support / Resistance 20 days | 141.32 / 162.52 |
| Data as of | 8 September 2026 20:30 WIB |
Track ORCL stock price daily: live levels, support/resistance and our full ORCL analysis history.



