Shell Stock Analysis: Gains 1.85%, Testing Key Resistance
On September 9, 2026: price 3,500.50 GBp, trend uptrend, RSI 63.9, support 3,288.00, resistance 3,482.50. technical analysis of shell stock.
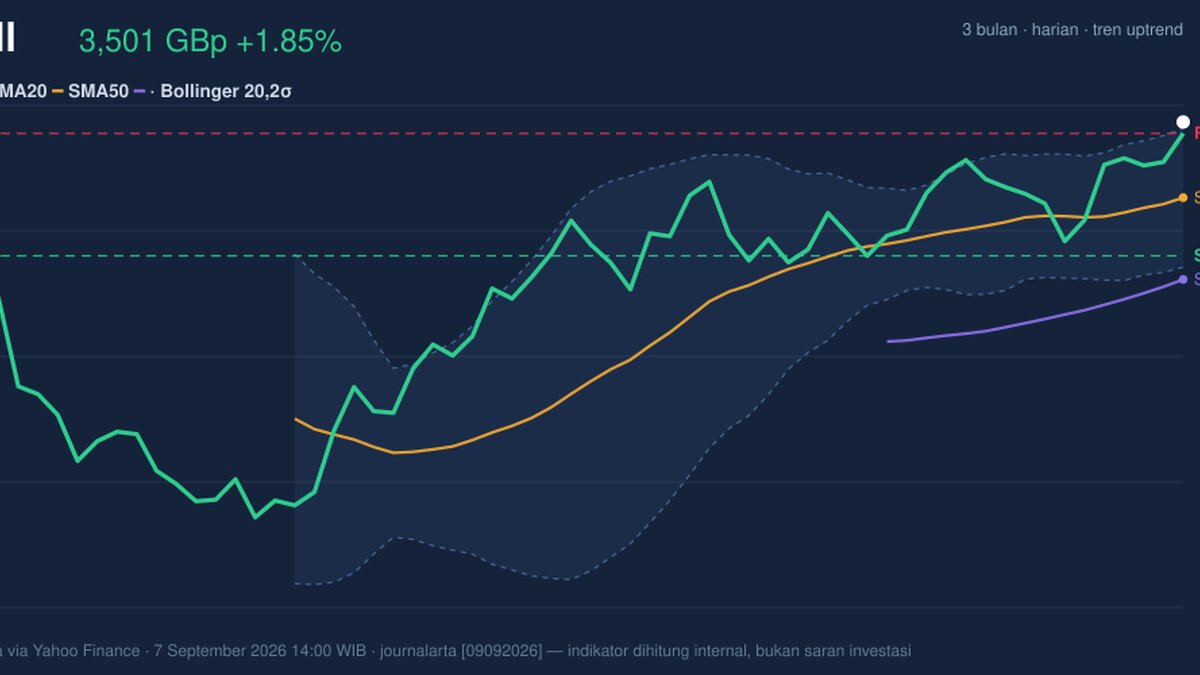
Shell plc edged higher on the LSE in London on 7 September 2026, with the shares last changing hands at 3,500.50 GBp, a move that pushed the stock to the top end of its recent trading range and just beyond the upper Bollinger band shown in the chart. The advance came on a day when the broader technical picture still leaned constructive, but not without warning signs: price is above its short- and medium-term averages, momentum remains positive, and volume has not fully confirmed the move.
Trend & Price Action
Shell’s chart is still set up as an uptrend, and the slope of the SMA20 — rising at 0.94% over five days — is the clearest sign that the recent climb has been orderly rather than abrupt. Price is holding above both the SMA20 at 3,380.43 and the SMA50 at 3,250.44, which tells traders the stock is trading above the levels where short- and medium-term buyers have recently been active.
That matters because moving averages often act like a rough map of crowd behaviour: above them, buyers are still setting the tone; below them, the market starts questioning that trend. Here, the absence of a fresh MA-cross means there is no new long-term trend signal to lean on, but the existing structure remains intact.
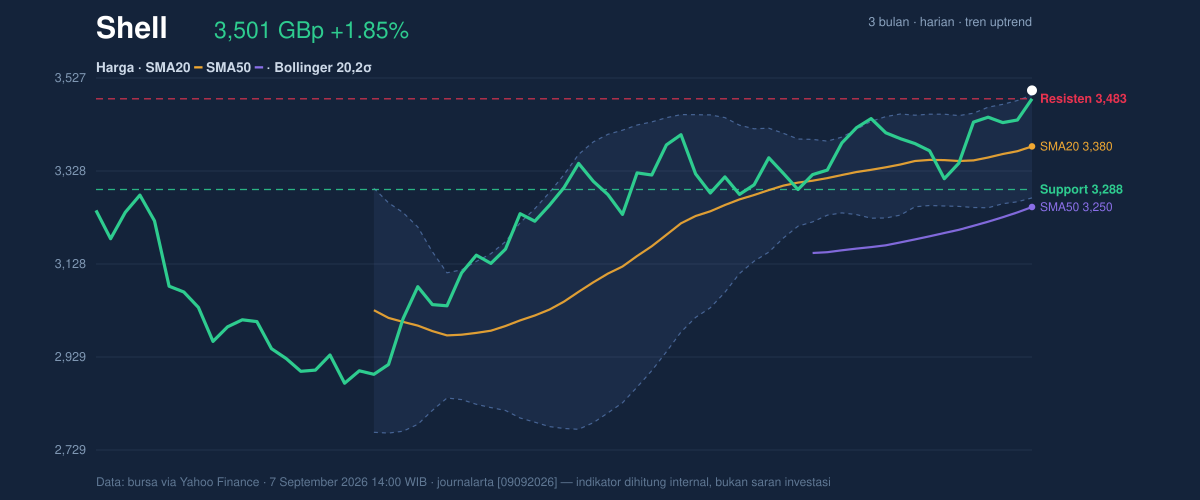
The chart also shows Shell sitting at 109% of its 20-hour range, with support at 3,288.00 and resistance at 3,482.50. Trading above that resistance is a meaningful technical message: it suggests the market has absorbed supply near the top of the range and is attempting to reprice the shares higher. The issue is that the stock is now very near the 3-month high of 3,501.00, so the next move may depend on whether buyers can keep pushing after this first test of the ceiling.
Oscillators & Momentum
The momentum indicators are mixed, which is often what happens when a stock is strong but extended. The RSI at 63.9 is still in neutral territory, meaning Shell is not yet flashing a classic overbought warning from that lens. But the Stochastic %K at 90.6 and %D at 82.4 are both overbought, which signals price is running close to the top of its recent range and may be vulnerable to a pause if fresh buyers do not appear.
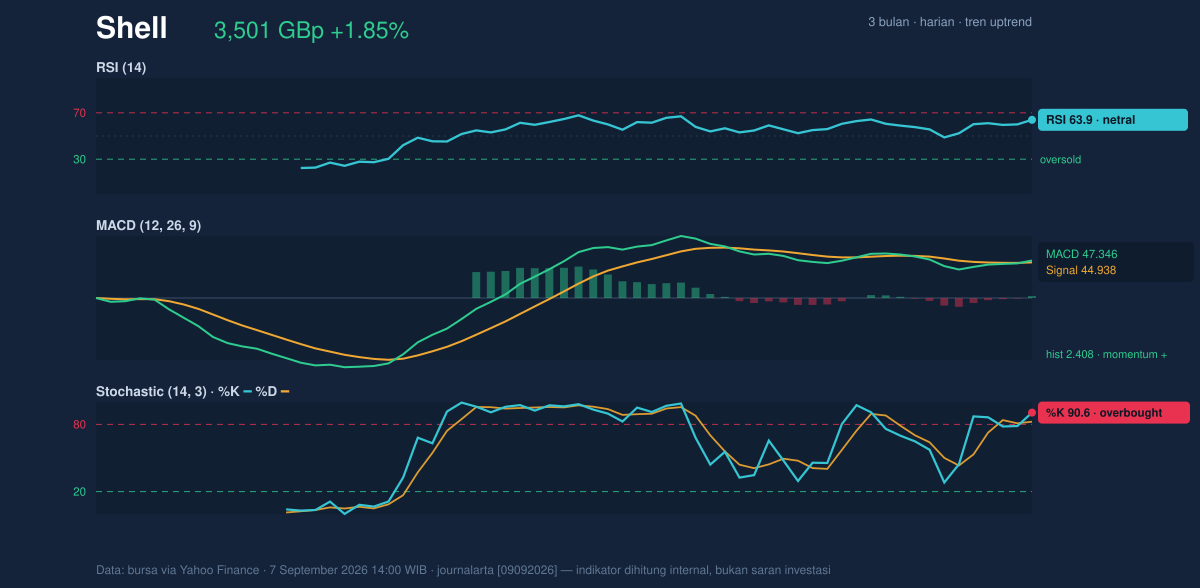
The more reassuring part of the setup is the MACD at 47.346, above its signal line at 44.938, with a positive histogram of 2.408. In plain English, that means the faster trend is still outrunning the slower one, so the stock’s upward momentum has not yet rolled over. The combination of a positive MACD and an overbought stochastic is important: it usually points to a trend that is still alive, but stretched enough to make short-term pullbacks more likely than a straight-line advance.
Volatility & Volume
Shell’s Bollinger Band structure is particularly interesting. Price is sitting above the upper band at 3,490.84, with the %B at 104%, which means the shares are trading beyond the normal upper volatility envelope. That is not automatically bearish; in a strong trend, it can mark a breakout. But it does mean the market is paying up relative to its recent statistical range, so the burden is now on follow-through rather than just momentum alone.
The band width is only 6.5%, and it is squeezing, which often precedes a larger directional move. A squeeze does not say which way the move will go; it says the market has been quiet enough to build pressure. In Shell’s case, the fact that price is pressing the upper band while the trend remains upward gives the breakout case more credibility than a breakdown case, though it still needs participation.
That is where volume complicates the picture. Last volume was 4,814,644, well below the 20-hour average of 10,313,837, or about 0.5x normal activity. Low volume on a push toward highs can mean conviction is thinner than the price action suggests. At the same time, OBV is rising, which indicates that, over time, volume flow has still been favouring accumulation rather than distribution. Put together, the message is that buyers remain in control, but they have not yet shown broad enough participation to fully validate a decisive breakout.
Key Levels & Scenarios
The technical map is straightforward. Immediate resistance is 3,482.50, with the 3-month high at 3,501.00 directly above it. A clean move through that zone would strengthen the case that Shell is transitioning from range-bound strength into a fresh leg higher. On the downside, support at 3,288.00 is the first level where dip buyers may try to defend the trend, while the SMA20 at 3,380.43 now acts as a nearer trend reference.
ATR(14) at 54.97, or 1.6% of price, says daily swings are moderate rather than explosive. That matters because it suggests any breakout attempt could still be measured and orderly, not necessarily violent. In other words, the stock has room to move, but not in a way that implies panic or disorder.
Technical Verdict: HOLD (wait & see)
HOLD (wait & see)
- The trend remains constructive because price is above the SMA20 at 3,380.43 and SMA50 at 3,250.44, with the SMA20 still rising.
- Momentum is positive because MACD is above its signal line and the histogram is positive, but the Stochastic is overbought, which raises the odds of a pause.
- The price is also above the upper Bollinger band at 3,490.84, but volume is only 0.5x the 20-hour average, so the breakout signal is not fully confirmed.
- Verdict invalidated if price falls below 3,288.00, because that would break the nearest support and weaken the current trend structure.
- Ideal Entry Range: 3,380.43 to 3,482.50
- Exit Target: 3,501.00, then the next move would need fresh confirmation beyond that high
- Stop Loss protection: below 3,288.00
For non-traders, this means Shell is still acting well, but the chart is asking for proof that the recent strength can hold before the next step higher. “The stock is leaning bullish, but it needs conviction, not just altitude.”
Summary Data Shell
| Last price | 3,500.50 GBp |
| Change 1 day / 5 days / 1 month | 1.85% / 4.66% / 6.80% |
| Trend / MA-cross | uptrend / none |
| SMA20 / SMA50 | 3,380.43 / 3,250.44 |
| RSI (14) / Stochastic %K | 63.9 / 90.6 |
| Bollinger %B / ATR | 104% / 54.97 |
| Support / Resistance 20 days | 3,288.00 / 3,482.50 |
| Data as of | 7 September 2026 14:00 WIB |
Track Shell share price daily: live levels, support/resistance and our full Shell analysis history.



